CONFOCAL MICROSCOPY OF CILIATED PROTOZOA
Giuliano Colombetti1, Giovanni Checcucci1, Paolo Bianchini2
1CNR Istituto Biofisica, Via G. Moruzzi 1, 56100 Pisa, Italy
giuliano.colombetti@pi.ibf.cnr.it
giovanni.checcucci@pi.ibf.cnr.it
2LAMBS-MicroScoBiO, Department of Physics, University of Genova, Italy
bianchinip@gmail.com
In this module, we describe how the use of a modern microscopy technique can be of help in investigating the spectroscopic properties and fluorescence lifetimes of possible photoreceptor pigments in microorganisms, measured as a function of their spatial distribution in the cell body. We also show how these measurements can give hints as to the function of the pigments in the cell. This contribution is limited to the case of ciliates with endogenous pigmentation, such as Blepharisma japonicum and Fabrea salina.
We start with a short introduction on the principles of confocal microscopy, followed by some remarks on photomovements. The structure and spectroscopic properties of hypericin-like molecules are given, since the above mentioned ciliates are known to posses pigments belonging to this class of molecules. We then present our results on the localization of fluorescence in the different parts of the cell body, with particular attention to the recently discovered presence of pigments in the cilia. In order to ascertain possible differences in the spectroscopic properties of the pigments along the cell body, we show the results of measurements of the spatial distribution of fluorescence emission and excitation. This analysis is completed and refined by presenting the results of FLIM (Fluorescence Lifetime Imaging Microscopy) measurements on our systems.
PRINCIPLES OF CONFOCAL MICROSCOPY
Currently, there is an increasing demand for three-dimensional (3-D) optical microscopy. The main reason lies in the fact that optical microscopy is still unique in its ability to allow the complete 3-D examination of biological structures in a hydrated state under experimental conditions that allow the preservation of living or physiological states (Diaspro, 1996). This fact coupled with the advent of fluorescence labelling permits the study of the complex and delicate relationships existing between structure and function in biological systems. One relevant step, in terms of progress in 3-D optical microscopy, was the invention of the confocal microscope (Wilson & Sheppard, 1984). Minsky, in 1957, invented a confocal microscope identical with the concept later developed extensively by Egger and Davidovits at Yale, by Sheppard and Wilson at Oxford, and by Brakenhoff et al. in Amsterdam (Minsky, 1998). It was in the mid-1970s, with the advent of affordable computers and lasers, and the development of digital image processing software, that the first confocal laser scanning microscopes became available in several laboratories, and were applied to biological and material specimens (Pawley, 1995; Paddock, 1999; Diaspro, 2002).
Within this scenario, multiphoton excitation (MPE) microscopy is probably the most relevant advancement in fluorescence optical microscopy since the introduction of confocal imaging (König, 2000; Masters, 2002; Periasamy & Diaspro, 2003; Bianchini & Diaspro, 2008). MPE microscopy has a 3-D intrinsic ability coupled with almost five other interesting capabilities, namely:
1. MPE greatly reduces photo-interactions, and allows imaging of living specimens for long time periods;
2. MPE operates in a high-sensitivity background-free acquisition scheme;
3. MPE microscopy can image turbid and thick specimens down to a depth of a few hundred micrometers;
4. MPE allows simultaneous excitation of different fluorescent molecules reducing colocalization errors; and
5. MPE can be used to prime photochemical reactions within a subfemtoliter volume inside solutions, cells, and tissues.
MPE fluorescence microscopy is not only revolutionary in its ability to provide the above-mentioned features, together with other practical advantages, but also in its elegance and effectiveness of application of quantum physics. MPE can be considered a young microscopical technique (Hell, 1996; Diaspro, 1999a, 1999b), and in general it is more convenient to use two-photon excitation (TPE) microscopy, for the sake of simplicity.
Principles of Confocal and Laser Scanning Microscopy. In conventional wide-field microscopes, specimens are entirely bathed in the radiation coming from the light source, and are viewed directly by eyes or through any capture device [charge-coupled device (CCD) camera, for example] or photosensitive film. This means that samples undergo full excitation on every instant, leading to in- and out-of-focus light points, contributing overlapping, worsening axial resolution, and producing that typical hazing in the collected images that, together with the light-diffraction effects, limits instrument performance. In fact, the observed image o(x, y, z), produced by the true intensity distribution i(x, y, z), is corrupted by the characteristic transfer function, i.e., point spread function (PSF), of the image formation system s(x, y, z), by additive noise stemming from different sources n(x, y, z), and by cross-information coming from different planes rather than from the focus one. At a certain plane of focus z0 within the sample or at different focal planes j along the z-axis (in what is usually known as optical sectioning), the observed image can be described by the following expression (Agard, 1984), where the sum is to be extended over the N image planes of the 3-D sample:
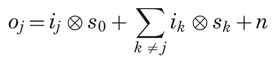
where ⊗ represents the convolution product, the subscripts on i and o refer to the discretized z plane, whereas the subscripts on s refer to the number of the k-plane away from the ''in-focus'' position at the actual jth plane.
This relationship is usually transferred to the Fourier frequency domain, where the convolution operator becomes an algebraic multiplication. Image restoration algorithms (deconvolution) aim to invert such equations to extract the true measured quantity i(x, y, z), thus allowing a 3-D sample reconstruction directly by piling up 2-D images, after further scale correction is performed, accounting for axial distortion phenomena linked to the refractive index mismatch. The solution of the problem is simplified when operating under the so-called confocal scheme (Wilson & Sheppard, 1984). The most important feature in confocal microscopy is the capability of discriminating between different focal planes, and collecting the signal selectively from a plane of focus from within a sample. This naturally leads to an improvement of the system performances, because fine details are often scarcely detected in conventional non-confocal fluorescent microscopes. This goal is achieved via two principal mechanisms that are at the basis of a point-to-point scanning of the selected plane of focus within the sample:
1) Incident light is focused to a spot (much smaller than the usual field of view) within the specimen through a very small aperture (pinhole). The benefits of such a focusing technique lie on the possibility of limiting the excitation of fluorescent dyes above and below the plane of focus.
2) Light emission from regions above and below the considered plane of focus is physically blocked from reaching the detector by means of a second pinhole (or of the same one, depending on the architecture of the system).
These mechanisms are often referred to as the ''confocal principle''. To acquire an image, the excitation light has to be fully delivered to each point of the sample, and the emission signal collected and displayed. Every confocal architecture is built such that the sample is placed along the light-path at a conjugate focal plane, and the movements along the optical axis keep the focus at a fixed distance from the objective, making it possible to effectively scan different fields of view through the specimen (thanks to a step-to-step motor device attached to the fine focus), and collect a series of in-focus optical slices for 3-D reconstruction.
The degree of confocality is a function of the pinhole size: the use of smaller pinholes improves the discrimination of focused light from stray light, thus involving a thinner plane in the image formation process and improving resolution, at the cost of a lower light throughput, which makes things difficult when dealing with particularly dim samples. In these architectures, vertical resolution (z) and optical sectioning thickness (which are basically the parameters involved in every optical sectioning process), depend on several factors such as the numerical aperture (NA) of the objective lens, the wavelength of the excitation/emission light, the pinhole size, the refractive index of components along the light path, and last but not least, the overall alignment of the instrument.
Principles of Two-Photon Microscopy (TPE). TPE of fluorescent molecules is a nonlinear process related to the simultaneous absorption of two photons, whose total energy equals the energy required for conventional, one-photon, excitation (Callis, 1997). This means that a fluorescent molecule that absorbs one photon at 340 nm, in the ultraviolet region, exhibiting fluorescence at 420 nm in the blue region can be excited at 680 nm in a two-photon process. All the considerations described below for TPE can be easily extended to the case of multi photon absorption. So far, the TPE process of a fluorescent molecule can take place only if two low-energy photons can interact simultaneously with the very same fluorophore. The main problem lies in the time scale for simultaneity (Esposito et al., 2004), which is the time scale of molecular energy fluctuations at photon energy scales, as determined by the Heisenberg uncertainty principle, i.e., 10-16 - 10-15 s.
Now, to have an idea of the rarity of the event, one should consider that under a bright daylight condition a good one- or two-photon excitable fluorescent molecule absorbs a photon through one-photon interaction about once a second, and a photon pair by a two-photon simultaneous interaction every 10 million years. This means that one needs a very high density of photons delivered to biological specimens under low perturbation conditions. The typical intensities are of the order of MW-TW cm-2. As the collisions of two or more photons with the very same molecule can be considered as statistically independent events, TPE is a process that has a quadratic dependence on the instantaneous intensity of the excitation beam. We can introduce the TPE molecular cross section as the propensity of a fluorescent molecule to absorb simultaneously two photons having a certain energy or wavelength. We also consider now the fluorescence emission as a function of the temporal characteristics of the TPE light intensity. Calculations can be easily extended to the multiphoton case.
Now, consider the most popular relationship (shown below) that is related to the practical situation of a train of beam pulses focused through a high numerical aperture objective, with a duration
 p and a repetition rate fp. In this case, the probability na, that a certain fluorophore simultaneously absorbs two photons during a single pulse, in the paraxial approximation, is:
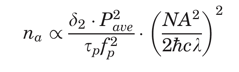
where c is the speed of light,
 is Planck's constant divided by 2
 , Pave is the time-averaged power of the beam, and λ is the excitation wavelength.
 This suggests that for optimal fluorescence generation, the desirable repetition time of pulses should be on the order of a typical excited-state lifetime, which is a few nanoseconds for commonly used fluorescent molecules. For this reason, the typical repetition rate is around 100 MHz. It is worth noting that when considering the effective fluorescence emission, one should consider a further factor given by the so-called quantum efficiency of the fluorescent molecules. It has been demonstrated that the fluorophore emission spectrum is independent of the single- or multiple-excitation modality (Xu, 2001).
Unfortunately, the knowledge of a one-photon cross section for a specific fluorescent molecule does not allow any quantitative prediction of the two-photon trend. The only ''rule of thumb'' that can help states that one may expect to have a TPE cross-section peak at double the wavelength needed for one-photon excitation, especially in symmetrical molecules. The very same consideration can be extended to the MPE case. However, when designing MPE experiments, one should properly consider lower order effects: for example, during three-photon excitation, two-photon absorption events can occur with a higher probability than the three photon ones, and make it impossible to determine the three-photon excitation wavelength peak.
Among the intrinsically fluorescent molecules, a special mention is due to the green fluorescent protein (GFP), which is is a universally known molecular marker in many biological processes, such as protein folding and transport, RNA dynamics and many others. GFP cross sections are around 6 GM (800 nm) and 7 GM (960 nm) in the case of the native and the S65T modified GFP, respectively. As a comparison, one should consider that a typical endogenous fluorescent molecule, such as reduced Nicotinamide Adenine Dinucleotide (NADH), has a cross section at its absorption maximum of about 0.02 GM.
In terms of optical consequences, the two-photon effect has the important result of limiting the excitation region to within a sub-femtoliter volume. The 3-D confinement of the TPE volume can be understood based on optical diffraction theory, and by referring to the optical sectioning scheme previously mentioned. Using excitation light with wavelength λ, the intensity distribution at the focal region of an objective with numerical aperture NA = n sin(
 ) (where n is the index of refraction of the medium in which the lens is working, and is the half-angle of the maximum cone of light that can enter or exit the objective) can be described by means of the intensity 3-D distribution (Born & Wolf, 1993). Compared with the one-photon case, the TPE intensity distribution is axially confined. In fact, its behavior is constant along z for one photon, and has a half-bell shape for TPE. The resulting behavior explains the three-dimensional discrimination property in TPE.
Figure 1C shows the probability distribution for the TPE of fluorescent molecules. Now, the most interesting aspect is that the excitation power falls off as the square of the distance from the lens focal point, within the approximation of a conical illumination geometry. In practice, this means that the quadratic relationship between the excitation power and the fluorescence intensity brings about the fact that TPE falls off as the fourth power of distance from the focal point of the objective. This fact implies that those regions away from the focal volume of the objective lens, directly related to the numerical aperture of the objective, do not suffer photobleaching or phototoxicity effects, and do not contribute to the signal detected when a TPE scheme is used. Because they are simply not involved in the excitation process, a confocal-like effect is obtained without the necessity of a confocal pinhole. It is immediately evident that an optical sectioning effect (see above) is obtained.
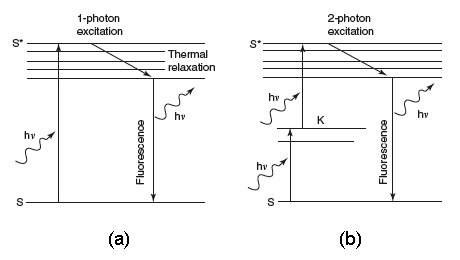
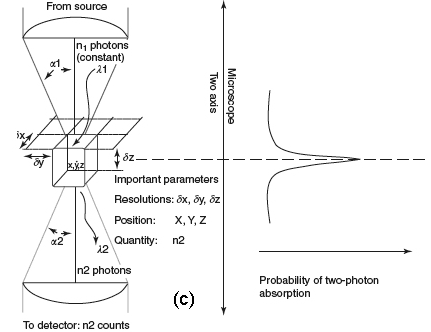
Figure 1. (a) Conventional and (b) TPE processes. (c) Distribution of TPE probability, adapted from Pawley's handbook (Pawley, 1995).
It is worth noting that the optical sectioning effect is obtained in a very different way with respect to the confocal solution. No fluorescence has to be removed from the detection pathway. In this case, one should be able to collect as much fluorescence as possible. In fact, fluorescence can come only and exclusively from the small focal volume traced in Figure 1C, which is of the order of a fraction of a femtoliter. Besides, the use of infrared wavelengths instead of ultraviolet-visible ones also allows deeper penetration than in the conventional case. In fact, Rayleigh scattering produced by small particles is proportional to the inverse fourth power of the wavelength. Thus, the longer wavelengths used in TPE, or in general in MPE, will be scattered less than the ultraviolet-visible wavelengths used for conventional excitation. Thus, deeper targets within a thick sample can be reached. Of course, for fluorescent light, scattering can be overcome by acquiring the emitted fluorescence using a large area detector.
Applications of Confocal Microscopy. The 3-D ability of the confocal scheme coupled to the natural property of fluorescence optical microscopy to allow imaging of living samples moves the imaging scenario in a four-dimensional world (x-y-z-t), where other dimensions can be added and other mechanisms of fluorescence excitation can be considered, like multiphoton excitation. So far, it is difficult to report about the several numerous current and potential applications (Pawley, 1995; Sheppard & Shotton, 1997; Diaspro, 2002). Also, the fast advances in setup are bringing confocal microscopy to a wider arena of applications, two of them are fast scanning systems that allow one to break the 2-ms-per-line temporal barrier (Pawley, 1995), and special setups for endoscopy that permit launching confocal imaging in the human body (Evans & Nishioka, 2005).
Most common applications of confocal microscopy are related to producing optical slices of transparent fluorescent specimens for 3-D reconstruction, stereo image production, and four-dimensional imaging; tracing specific molecules, cells, or structures through tissues; determining the cellular localization of ions, RNA, DNA, proteins, cytoskeletal components, and organelles (Born & Wolf, 1993; Pawley, 1995; Diaspro et al., 1999; Paddock, 1999; Xu, 2001; Evans & Nishioka, 2005). Many other applications can be found in the literature; the Masters' volume on Selected Papers on Confocal Microscopy (Masters, 1996) can be used as an effective starting point.
In terms of applications, the advent of the so-called green fluorescent proteins (GFPs) (Tsien, 2005) and quantum dots (QDs) (Alivisatos et al., 2005) coupled to original approaches like FRAP (fluorescence recovery after photobleaching), FRET (Foerster resonance energy transfer), FLIM (fluorescence life-time imaging), and FCS (fluorescence correlation spectroscopy), also known as ''F'' techniques, is adding value to confocal and TPE microscopy, allowing one to get quantitative information from the very complex, intricate, and delicate world of biological systems (Pawley, 1995). Several applications are related to calcium mapping in cells, intact brain, and brain slices (Diaspro et al., 2006a, 2006b). Signaling mechanisms at individual synapses can be monitored in brain slices. Dynamic processes in the brain require long-term imaging that a TPE approach can uniquely provide, while limiting the bleaching of out of focus planes in the sample. It is possible to study structural reorganization in the brain on a slow time scale compared with neural activity. This can be done with cranial windows similar to that used in cancer research, where the skull is removed over a small area, and permanently replaced with a cover glass. TPE imaging is also possible through the thinned skull of living animals (Diaspro et al., 2006a, 2006b). The overall approach is minimally invasive, and allows stable imaging over a period of weeks.
Since protein expression patterns are a primary determinant of tissue function, a method to access macroscopic distances at subcellular levels of detail is of great interest. Moreover, new preparations, fluorescent probes, and imaging techniques are providing the means to observe the behavior of cells in the tissue environment of lymphoid organs. When combined with two-photon laser microscopy, intravital imaging of surgically exposed lymph nodes provides a unique view of lymphocyte migration and antigen presentation as it occurs within the living animal. In general, the main advantage of TPE microscopy in the study of the immunological response lies in the possibility to perform in vivo observations. Even more interesting is the capability of TPE microscopy to track DNA in living cells.
A recent review (Diaspro, 2004) on anti-cancer research has discussed how to perform DNA imaging or tracking in living cells by means of two-photon laser scanning microscopy. Tracking drug delivery in subcellular compartments with the mapping of sites of critical drug-DNA interactions was particularly addressed.
PHOTOMOVEMENT
It is worthwhile to reflect a bit on the reason why photomovements are important and why generations of scientists have studied them, spending hours at the microscopes in the early times, and then developing more and more complicated observation instruments, like the modern automated tracking systems. The main reason for this is that to measure photomovements is exactly equivalent to asking a man whether he sees a red or a yellow light. In other words, to perform a measurement of phototaxis simply means to ask the cell a question and record the answer, where the question is the light stimulus and the answer the change in movement. In fact, the question can get a bit more complicated, and one can "ask" using different fluence rates, different wavelengths, and even different polarizations. It's a sort of a psychophysics experiment, where, instead of recording simple answers to questions or measuring sophisticated electrophysiological responses, the researcher simply studies a behavior. The major difference is that in the case of higher systems the behavior may be complex, while in the case of microorganisms it is usually stereotyped. Of course, this approach is not exhaustive, and it cannot give in itself a definite answer as to the nature of the receptor pigments or to the steps of the subsequent dark chain of molecular events that take place in a cell after light absorption.
Notwithstanding these apparent limitations, the study of photomovement has been for years, and is even now, a very useful and simple tool to start getting information on the cell machinery underlying photosensory responses in microorganism. After all, one should not forget that the first steps in the investigation of the sophisticated mechanisms of chemotaxis started with the measurement of ring formations in simple Petri dishes. Furthermore, the behavioral approach can be used to test the predictions of more sophisticated molecular models. Photobehavior can be studied at the level of single cells or of cells populations. In both cases the modern techniques of image analysis coupled to CCD cameras have made it possible to significantly improve the precision of measurements, and to make more reliable models that have helped clarify some aspects of, for instance, the oriented movement of cells with respect to light direction (Marangoni et al., 2000).
MICROORGANISMS
A picture of B. japonicum, with confocal images taken in absorption and fluorescence, plus a superposition of the two, is shown in Figure 2. Here, as in what follows, the picture is represented in false colors. B. japonicum can exist in two forms: the wild one, called red B. japonicum, is red-colored while the other one, called blue B. japonicum, generated by irradiating the cells with dim visible light, is blue-colored.
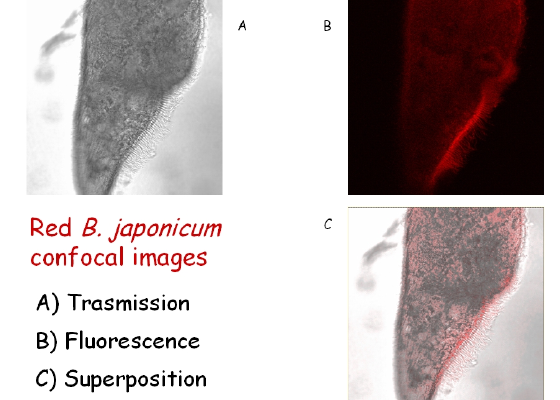
Figure 2. Images of B. japonicum taken with a confocal microscope. By overlapping Figures 2A and 2B, the fluorescent parts of the cell body can be clearly detected.
The pigments are known as red blepharismin and blue blepharismin (or oxyblepharismin), respectively (Figure 3). Like other hypericin-like molecules, red blepharismin is a good photosensitizer, therefore red B. japonicum gathers in the dark to avoid the photodynamic action of the pigment. Blue blepharismin is also a good photosensitizer in vitro, however, blue B. japonicum does not seem to be affected by light irradiation in vivo, and survives even under high intensity light. Both red and blue forms of B. japonicum exhibit a stereotyped and casual change of direction upon an increase in light intensity (step-up photophobic response).
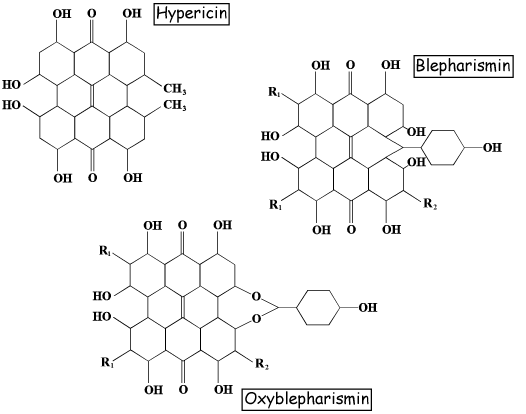
Figure 3. Molecular structures of hypericin and of red and blue blepharismin.
F. salina is heavily pigmented, with a blackish color, and its pigment is known as fabrein (Figure 4). Not very much is known about the molecular structure of fabrein, but some evidence strongly suggests that this is a hypericin-like molecule similar to blepharismin. Notwithstanding the fact that fabrein belongs, in principle, to a class of good photosensitizers, F. salina cells do not undergo photokilling. The cells actively swim toward light, probably using this photoresponse to find the unicellular algae upon which they feed. The movement toward lighted areas is the result of a combination of stereotyped and casual changes of direction after a decrease of light intensity (step-down photophobic response), together with a directional swimming toward the light (positive phototaxis). Whether these different behaviors to light stimulation are due to different photoreceptors is still an open question that unfortunately cannot be answered by confocal microscopy.
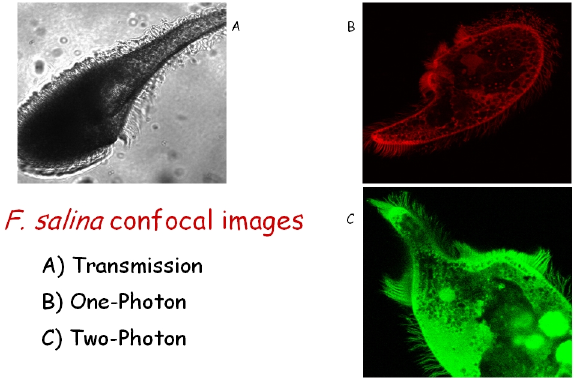
Figure 4. Images of F.salina taken with a confocal microscope. The bright spots in the body of panel C are due to the fluorescence of digested Dunaliella salina cells. Panel C shows the high degree of spatial resolution of the cilia that can be obtained by using TPE.
CILIARY FLUORESCENCE
Since hypericin-like pigments fluoresce, we have investigated their spectroscopic properties in intact cells by means of single and two-photon confocal microscopy. Since living cells, even when immobilized by different methods, have an almost undetectable fluorescence emission, we have fixed our samples with 3% paraformaldehyde, which causes a significant increase of fluorescence, by at least a factor of ten. Figure 5 shows the image of the anterior part of F. salina in single photon fluorescence confocal microscopy.
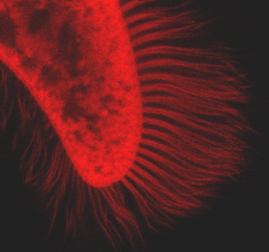
Figure 5. Ciliary fluorescence of a F. salina cell. This picture is a clear indication that not only the cell body, but also the cilia fluoresce.
The optical sectioning of a cell of F. salina is shown in Figure 6. The different images, corresponding to different focal planes, allows one to follow the 3-D distribution of the pigments in the cell body. It is interesting to note that the more brilliant green spots are due to chlorophyll fluorescence of the remnants of digested Dunaliella salina cells, an alga used to feed the ciliate.
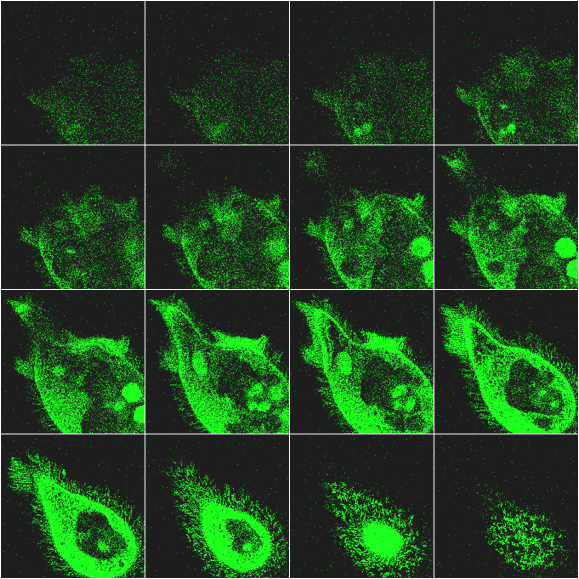
Figure 6. Example of optical sectioning of a cell of F.salina. For more details see text.
Figure 7 shows that the pigment fluorescence is localized not only in the cell body, but also in the cilia of B. japonicum.
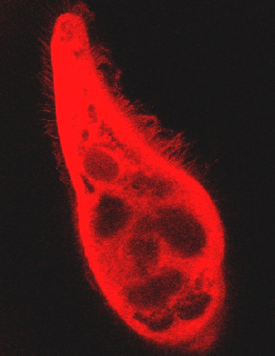
Figure 7. Fluorescence of the cilia of B. japonicum. This picture clearly indicates that the cilia fluoresce, as does the cell body.
Figure 8 shows the optical sectioning of a B. japonicum cell; as in the case of F.salina (Figure 6), it is possible to follow the 3-D distribution of the pigment in the cell body. It is of interest to see in several sections how clearly detectable are the kineties, i.e., the rows along which the cilia are arranged.
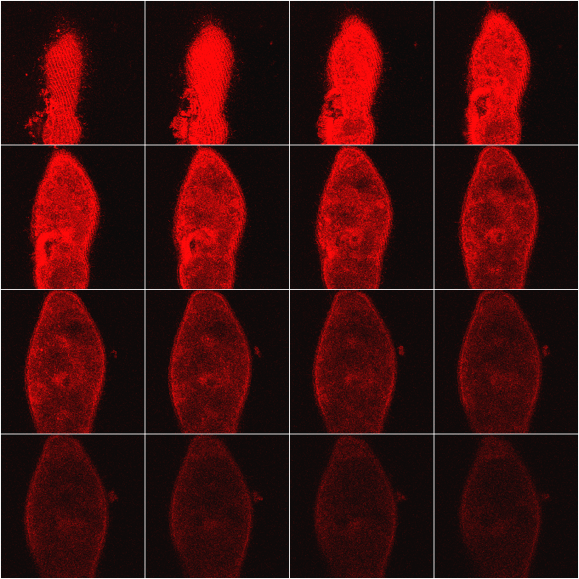
Figure 8. Example of optical sectioning of a cell of B. japonicum. For more details see text.
From Figures 7 and 8, it is apparent that the pigment is also present in the cilia. This evidence has been documented for the first time by our group (Colombetti et al., 2007), and it could have important implications for the mechanism of cellular responses to light. In fact, being the locomotory organelle of these cells, photoinduced reactions taking place in the cilia might have a direct influence on cell motion modulation. In order to confirm that cilia do fluoresce, we have performed in situ photobleaching experiments (Figure 9). The results clearly show that cilia are bleached by light, and therefore there is a high probability that they contain an endogenous pigment. Similar results have been obtained for both forms of B. japonicum.
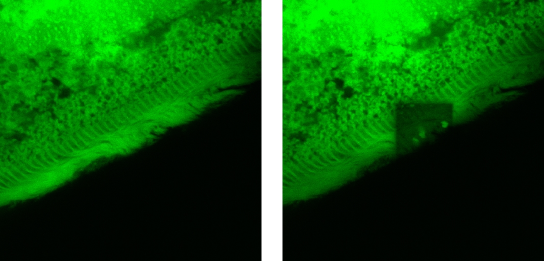
Figure 9. Photobleaching of the cilia of F. salina. The left pane represents a confocal image of the ciliary region of the cell; the right pane shows within the same image a roughly square region that was irradiated for 15 min using the same laser light of the confocal microscope at a higher irradiance. It is apparent that in this square region the fluorescence is almost completely quenched.
The presence of the chromophore in the cilia, indicated by ciliary fluorescence, has important implications for the structure and function of the photoreceptor pigment. In fact, it has always been assumed in the literature that the photoreceptor pigments are contained in pigment granules usually present under the cell membrane, and models were developed trying to relate this pigment confinement to its possible photoreceptor function (Marangoni et al., 1996b; Matsuoka et al., 2000). However, the pigments in the cilia cannot be contained in granules, at least not in granules as big as the ones present in the cell body, simply because the cilia do not offer any room to accommodate such structures. Just to give some orders of magnitude, the average pigment granule is spherical in shape with a diameter between 0.5 and 1 µm, which is more or less the diameter of the cilium. However the inner volume of the cilium is mainly filled up with the motor structures (i.e., the typical 9+2 microtubular axoneme structure made of tubulin and dynein), and therefore there is no room for granules.
In order to better understand the spatial localization of pigments in the cilia, one should have a resolution power greater than ordinary confocal microscopy. Work is in progress to understand whether it is possible to address this question with more sophisticated techniques such as STED (Stimulated Emission Depletion) confocal microscopy, which enables the investigation of structural details below the 100 nm resolution range. Preliminary measurements have shown that it is possibile to use STED on these ciliates.
FLUORESCENCE EMISSION AND EXCITATION SPECTRA
Figure 10 shows the fluorescence excitation spectra recorded in different locations in the cell body of the ciliates under investigation. These measurements were performed using a white light laser (WLL) as the light source. The term "white light laser" indicates a laser with a continuous spectrum, including all wavelengths from blue to red. The pulsed WLL used had a useful range from 470 nm to 670 nm, a repetition rate of 80 MHz, and a pulse width of 1-2 ps. It is apparent from Figure 10 that there is a substantial homogeneity in the spatial distribution of fluorescent pigments all over the cell bodies for all the ciliates investigated.
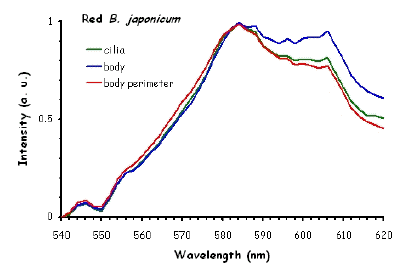
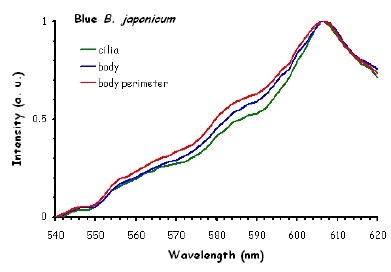
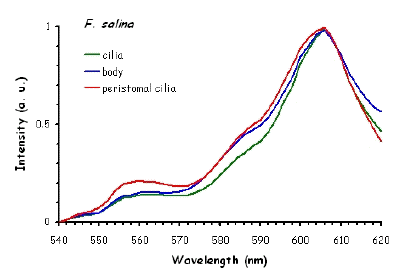
Figure 10. Excitation spectra recorded in different parts of the cells body.
The excitation spectra have some common features, but there is a major difference between the red B. japonicum cells on the one side and the blue ones and F. salina on the other side. All the cells show a spectrum with two major components, one centered at about 608 nm, and the other at about 585 nm. In the case of blue B. japonicum and F. salina, the spectrum peaks at about 608 nm and there is a shoulder at about 585 nm. The excitation spectrum of red B. japonicum, instead, has two equivalent peaks at about 585 nm and 608 nm. These results should be compared to what is reported in the literature (Angelini et al., 1995; Marangoni et al., 1996a). As expected, the spectrum of blue B. japonicum is shifted towards the red, even though the results reported earlier do not show such a large spectral shift. The excitation spectra of red B. japonicum seems to be ascribable to a mixture of two components, one, the peak at 580 nm, to be compared to the absorption spectrum of red blepharismin and the other one, at 608 nm resembling the spectrum of blue blepharismin. The simplest explanation is that this might be due to a partial photooxidation of the red pigment, which may have taken place during the phase of cell manipulation, or even be caused by laser irradiation during the fluorescence measurements. The spectra of the blue form and of F. salina are clearly superimposable, at least in the red region; this allows us to conclude that the blue form of blepharismin has fluorescence properties similar to the pigment of F. salina. This is indicative of a common nature of the blue pigment and of fabrein. Taken together with the indications of the literature and some of our previous measurements, this may point to a common nature of fabrein and blue blepharismin. The emission spectra (Figure 11) for each type of cell are consistent with the literature, and do not show any meaningful difference between the different parts of the cell bodies.
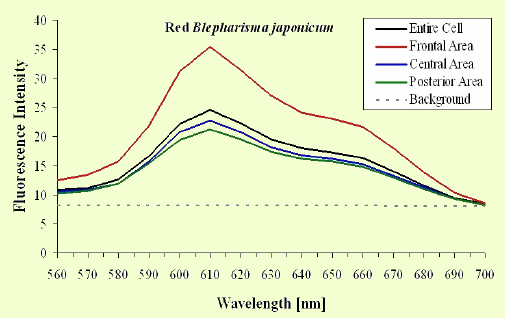
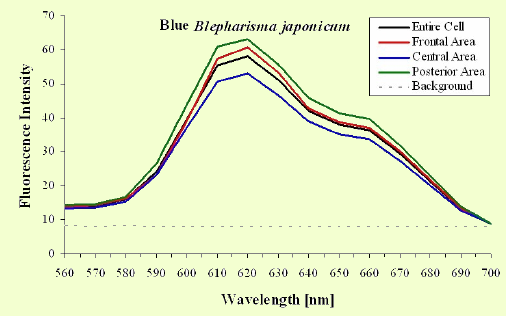
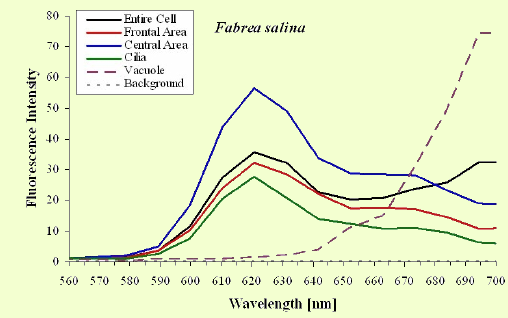
Figure 11. Emission spectra recorded in different parts of the cells body. The dotted part represents chlorophyll fluorescence from ingested Dunaliella cells.
FLIM ANALYSIS
The similarity of the emission and excitation spectra in different parts of the cell body is not, in itself, sufficient proof that there is no pigment spatial heterogeneity in the cells. Therefore, we have measured time-resolved fluorescence of the cells by means of the FLIM technique, in order to determine whether there is a correlation between fluorescence lifetimes and the spatial localization of the pigments. A FLIM image of a F. salina cell, together with a Scanning Electron Microscope (SEM) image of another cell, are shown in Figure 12. The spatial distribution of lifetimes has been analyzed in terms of gaussian components (Figure 13).
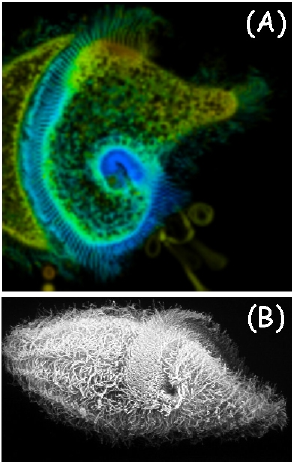
Figure 12. (A) Fluorescence lifetime imaging of a cell of F. salina. (B) SEM image of a different cell.
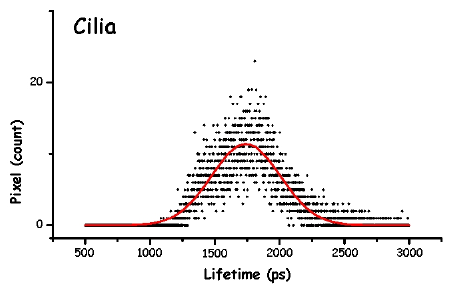
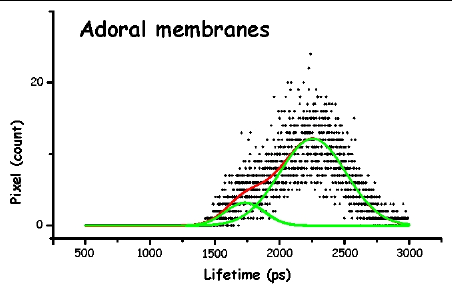
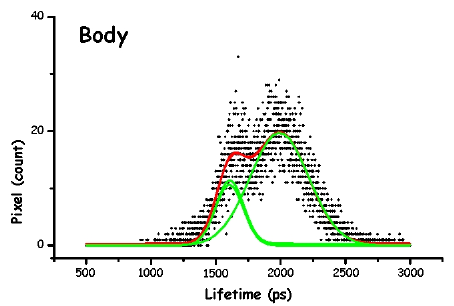
Figure 13. The pictures represent the histograms of the measured lifetimes (height at time t proportional to number of pixels showing that lifetime) in F. salina. The green and red lines are the theoretical curves fitted to the experimental data, in particular the green lines show the two major lifetime distributions.
In order to make the analysis simpler and easier to understand, we have divided the cell body into three main areas: the locomotor organelle (cilia), the cell body, and the adoral region (i.e., near the mouth). The results are shown in Table 1. There are meaningful differences between the average lifetimes measured in the different regions.
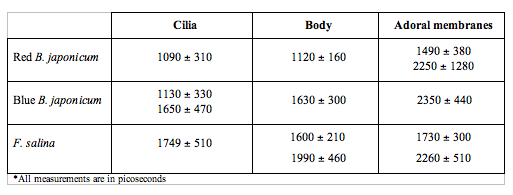
Table 1. Fluorescence lifetimes of the different regions of the cell body for the three investigated cells. Each measurement is the average of at least ten different cells for each type.
The most interesting feature is that, for all cell types, the cilia always have a short lived fluorescence component, while in general the adoral region is the longest lived. In both forms of B. japonicum the value of the short component is of the order of 1.1 ns, whereas in F. salina this value goes up to 1.8 ns. The average lifetimes of F. salina are in any case comparatively higher than in B. japonicum.
It is possible to try and correlate these differences to the different role that these pigments might play in the photoresponse. First we have to remind the reader that he structure of the pigment in the cilia has to be different than that in other parts of the cell body. Since ciliary pigments cannot be contained in pigment granules, they must be somehow linked to ciliary structures. An intriguing possibility is that they could directly control calcium channel permeability. The lower lifetime of the pigments of the cilia could indicate a functional role for them; in fact, if the light energy absorbed is utilized for some biological function, such as ciliary channel control, a shorter fluorescence lifetime is expected.
CONCLUSIONS
The results presented in this article show how the application of a modern microscopic technique has allowed the discovery that the presumed photoreceptor pigment of B. japonicum and F. salina is present not only in the cell body, but in the cilia, as well. This finding may have important implications for the photosensory transduction mechanism in these ciliates. In fact, it has always been assumed that the photoreceptor pigments are contained in pigment granules, and models were developed trying to relate this pigment confinement to its possible photoreceptor function. However, the pigments in the cilia cannot be contained in granules, at least not in granules as big as the ones present in the cell body, simply because the cilia do not offer any room to accomodate such structures. Just to give some orders of magnitude, the dimensions of an average granule are between 0.5 and 1 µm, while the diameter of the cilium is more or less the same, but its inner volume is completely filled up with the motor organelle, that is the 9+2 microtubular axonemal structure made of tubulin and dynein. In order to better understand the spatial localization of pigments in the cilia, one should have a greater resolution power than ordinary confocal microscopy.
Work is in progress to understand whether it is possible to address this question with more sophisticated techniques such as STED (Stimulated Emission Depletion) confocal microscopy, which enable the investigation of structural details below the 100 nm resolution range. Our confocal measurements of steady state emission and excitation fluorescence do not indicate meaningful differences between different parts of the cell body, whereas this is not true for lifetimes. The spatial distribution of the average lifetimes shows meaningful differences between different regions of the cell body. The most interesting feature is that for all cell types, the cilia always have a short lived component, while in general the adoral region has the longest lived one. In both Blepharismas the value of the short component is of the order of 1.1 ns, whereas in Fabrea this value goes up to 1.8 ns. The average lifetimes of Fabrea are in any case comparatively higher than in the Blepharismas. The lower lifetime of the pigments of the cilia could indicate a functional role for them; in fact, if the light energy absorbed is utilized for some biological function, such as ciliary channel control, a shorter fluorescence lifetime is expected.
REFERENCES
Agard D. A. (1984) Optical sectioning microscopy: Cellular architecture in three dimensions. Annu Rev Biophys., 13: 191-219.
Alivisatos A. P., Gu W., Larabell C. (2005) Quantum dots as cellular probes. Annu. Rev. Biomed. Eng., 7: 55-76.
Angelini N., Cubeddu R., Ghetti F., Lenci F., Taroni P., Valentini G. (1995) In vivo spectroscopic study of photoreceptor pigments of Blepharisma japonicum red and blue cells. Biochim Biophys Acta, 1231: 247-254.
Bianchini P., Diaspro A. (2008) Three-dimensional (3D) backward and forward second harmonic generation (SHG) microscopy of biological tissues. J. Biophot., 1: 443-450.
Born M., Wolf E. (1993) Principles of Optics, 6th ed. Pergamon Press, Oxford.
Callis P. R. (1997) Two-photon-induced fluorescence. Ann. Rev. Phys. Chem., 48: 271-297.
Colombetti G, Checcucci G, Lucia S, Usai C, Ramoino P, Bianchini P, Pesce M, Vicidomini G, Diaspro A. (2007) Evidence for ciliary pigment localization in colored ciliates and implications for their photosensory transduction chain: A confocal microscopy study. Microsc. Res. Tech., 70: 1028-1033.
Diaspro A. (1996) New world microscopy. IEEE Eng. Med. Biol. Mag., 15: 29-100.
Diaspro A. (1999a) Two-photon microscopy. Microsc. Res. Tech., 47: 163-212.
Diaspro A. (1999b) Two-photon excitation microscopy. IEEE Eng. Med. Biol. Mag., 18: 16-99.
Diaspro A. (ed.) (2002) Confocal and two-photon microscopy: Foundations, applications, and advances. Wiley-Liss, New York.
Diaspro A. (2004) Rapid dissemination of two-photon excitation microscopy prompts new applications. Microsc. Res. Tech., 63: 1-2.
Diaspro A., Annunziata S., Raimondo M., Ramoino P. (1999) A single-pinhole confocal laser scanning microscope for 3-D CONFOCAL MICROSCOPY imaging of biostructures. IEEE Eng. Med. Biol. Mag., 18: 106-100.
Diaspro A., Caorsi V., Bianchini P., Chirico G., Usai C. (2006a) Multiphoton Microscopy. In "Wiley Encyclopedia of Biomedical Engineering". Wiley-Liss, New York, pp. 2386-2394.
Diaspro A., Federici F., Faretta M., Usai C. (2006b) Confocal Microscopy. In "Wiley Encyclopedia of Biomedical Engineering". Wiley-Liss, New York, pp. 993-1000.
Esposito A., Federici F., Usai C., Cannone F., Chirico G., Collini M., Diaspro A. (2004) Notes on theory and experimental conditions behind two-photon excitation microscopy. Microsc. Res. Tech., 63: 12-17.
Evans J. A., Nishioka N. S. (2005) Endoscopic confocal microscopy. Curr. Opin. Gastroenterol., 21: 578-584.
Hell S. W. (1996) Nonlinear optical microscopy. Bioimaging; 4: 121-172.
König K. (2000) Multiphoton microscopy in life sciences. J. Microsc., 200: 83-104.
Marangoni R., Cubeddu R., Taroni P., Valentini G., Sorbi R., Lorenzini E., Colombetti G. (1996a) Microspectrofluorometry, fluorescence imaging and confocal microscopy of an endogenous pigment of the marine ciliate Fabrea salina. J. Photochem. Photobiol. B: Biol., 34: 183-189.
Marangoni R., Gobbi L., Verni F., Albertini G., Colombetti G. (1996b) Pigment granules and hypericin-like fluorescence in the marine ciliate Fabrea salina. Acta Protozool., 35: 177-182.
Marangoni R., Preosti G., Colombetti G. (2000) Phototactic orientation mechanism in the ciliate Fabrea salina, as inferred from numerical simulations. J. Photochem. Photobiol. B: Biol., 54:185-188.
Masters B. R. (1996) Selected Papers on Confocal Microscopy. SPIE Press, Bellingham, WA.
Masters B. R. (2002) Selected Papers on Multiphoton Excitation Microscopy. SPIE Milestone Series. SPIE Press, Bellingham, WA.
Matsuoka T., Tokumori D., Kotsuki H., Ishida M., Matsushita M., Kimura S., Itoh T., Checcucci G. (2000) Analyses of structure of photoreceptor organelle and blepharismin-associated protein in unicellular eukaryote Blepharisma. Photochem. Photobiol., 72: 709-713.
Minsky M. (1998) Memoir of inventing the confocal scanning microscope. Scanning; 10: 128-138.
Paddock S. V. (ed.) (1999) Methods in Molecular Biology, Vol. 122: Confocal Microscopy, Methods and Protocols. Humana Press, Totowa, N.J.
Pawley J. B. (ed.) (1995) Handbook of Biological Confocal Microscopy, 2nd ed. Plenum Press, New York.
Periasamy A., Diaspro A. (2003) Multiphoton microscopy. J. Biomed. Opt.; 8: 327-328.
Sheppard C. J. R., Shotton D. M. (1997) Confocal Laser Scanning Microscopy. BIOS Scientific Publishers, Oxford, U.K.
Tsien R. Y. (2005) Breeding molecules to spy on cells. In "The Harvey Lectures: Series 99, 2003-2004". Harvey Society, New York, pp. 77-93.
Wilson T., Sheppard C. J. R. (1984) Theory and Practice of Scanning Optical Microscopy. Academic Press, London, U.K.
Xu C. (2001) Cross-sections of flurorescence molecules in multiphoton microscopy. In "Confocal and Two-Photon Microscopy: Foundations, Applications and Advances" (A. Diaspro, ed.). Wiley-Liss, New York, pp. 75-99.
04/30/09
09/14/11