ACTION SPECTRA
Their Importance for Low Level Light Therapy
Tiina Karu
Laboratory of Laser Biomedicine
Institute of Laser and Information Technologies
Russian Academy of Sciences
Troitsk 142190, Moscow Region, Russian Federation
tkaru@isan.troitsk.ru
www.isan.troitsk.ru/dls/karu.html
1. INTRODUCTION
The radiation wavelengths effective for photobiology range between 300 and 900 nm, i.e., from UV (ultraviolet) to near IR (infrared). Practically all photobiological processes in plants and animals, such as photosynthesis, phototropism, phototaxis, photoperiodism, and vision, utilize this range of radiation. The photoreceptor molecules responsible for these photoresponses have been well studied for decades.
The regulation of cellular metabolism by visible light is not a classical topic of photobiology. Only the finding of the existence of action spectra in the region from 330 to 860 nm for the increase of DNA and RNA synthesis rates in mammalian cells, as well as for growth stimulation of eukaryotic and prokaryotic microorganisms recorded in the 1980's (reviewed in 1), indicated that monochromatic light in the visible-to-near region can be a subtle instrument to regulate cellular metabolism. This finding means that the topic of low level laser phototherapy (or low level light therapy, or laser biostimulation) belongs to photobiology.
An action spectrum is a plot of the relative effectiveness of different wavelengths of light in causing a particular biological response, and under ideal conditions, it should mimic the absorption spectrum of the molecule that is absorbing the light, and whose photochemical alteration causes the effect (2).
The first action spectra with the aim to prove or disapprove the existence of a so-called laser biostimulation effect at the cellular level were recorded in the early 1980's (3-5). Recall that laser biostimulation (nowadays called low level laser therapy, low level light therapy, photobiomodulation or laser phototherapy) as a medical treatment goes back into the 1960's with the use of a He-Ne laser (
 = 632.8 nm) for the improvement of the healing of impaired wounds.
With the technical progress in the second half of the 20th century, and the advent of the laser, these new light sources found their application in medicine and in therapy. The ruby laser (
= 694 nm), which was the first laser invented in 1960, was used in ophthalmology and dermatology very soon after its appearance. Endre Mester, who is considered as the father of "laser biostimulation", also used the ruby laser in 1964. But the real boom in the therapeutic use of lasers started soon after the invention of the He-Ne laser in 1961, because the He-Ne laser ( = 632.8 nm) was the first widely available commercial laser. The stimulating effect of light, and red light in particular, was rediscovered when this new light source was used. The observed effects were attributed to the unique, high coherence of the He-Ne laser radiation, although there are no physical grounds for such a conclusion (6).
Prof. Mester also used the He-Ne laser in his practice, and performed a lot of pioneering studies at the cellular level. At the same time (end of the 60's - beginning of the 70's), the large-scale use of He-Ne lasers in laboratories and clinics started in the USSR (Harkov University, Kazahztan State University in Alma-Ata, Institute of Physics in Minsk, Institute of Oncology Problems in Kiev, Institute of Radio Engineering and Electronics in Fryazino, Moscow Region). The spreading of laser biostimulation to various countries started at the end of the 70's, and got a wider interest (Italy, Japan, United Kingdom, and China) after the appearance of semiconductor medical lasers in the 80's.
The action spectra in the visible-to-near IR region for the biological responses of cultured cells showed that red light at 632.8 nm was not the only wavelength suitable for laser biostimulation (3-5). These spectra together with the results of experiments using the dichromatic irradiation of cells, and the modification of light effects with chemicals (6-9), showed that "laser biostimulation" is a photobiological phenomenon. These data also allowed the suggestion that the photoacceptor for the stimulation of cell metabolism is the terminal enzyme of the respiratory chain, i.e., cytochrome c oxidase for eukaryotic cells (9), and the cytochrome bd complex for Escherichia coli (10). In the blue spectral region, flavoproteins like NADH-dehydrogenase can work as photoacceptors as well (8). The suggestion that cytochrome c oxidase is the photoacceptor molecule has been recently confirmed in elegant experiments with functionally inactivated primary neurons, proposing that light upregulates this enzyme (11).
A surprising circumstance is that the photoacceptors for this phenomenon in eukaryotic cells and in prokaryotic cells (E. coli) appeared to be natural components of the respiratory chain, and not specialized photoreceptor molecules. This is different from the classical photobiological phenomena that utilize specific photoreceptors (chlorophylls, rhodopsins, etc.). On the other hand, it is not surprising from the point of view of the absorbing centers in the photoacceptor (for eukaryotic cells these are Cu and quite probably Fe in cytochrome c oxidase, see Section 3). Transition metals (Cu and Fe) generate electronically excited states under very moderate reaction conditions. Bioorganic photochemistry, a rapidly developing new area of research, is concerned with the biological aspects of transition metal chemistry, and physics under irradiation (12). Last but not least, the activation of some enzymes by light, a closely similar phenomenon, is also known (13, 14). Since life evolved in a world of light, there must be many interactions between biological systems and light, including accommodations for its deleterious effects (15).
The initial action spectra will be described in Section 2. The analysis of how the photoacceptor was determined from these spectra, is the topic of Section 3. Section 4 describes the comparison of action and absorption spectra. Section 5 is devoted to a brief analysis of how the signals generated by light quanta in mitochondria are transduced to the cellular organelles, where the initial action spectra were measured (the nucleus).
|
1. Any graph representing a photoresponse as a function of wavelength , wave number -1, or photon energy e, is called an ACTION SPECTRUM. 2. Action spectroscopy analyzes effects caused by irradiation in order to characterize the pigments involved (called photoacceptors or photoreceptors). 3. After determining the photoacceptor molecule, whos absorption spectrum is mirrored in the initial action spectrum, one can make suggestions about cellular signaling pathways inside a cell between the tentative photoacceptor and the molecule whos activity was measured by action spectroscopy. |
2. ACTION SPECTRA for an INCREASE of DNA and RNA SYNTHESIS RATE in CULTURED MAMMALIAN CELLS
First at all, let us remember that in eukaryotic cells, DNA and RNA synthesis occur in the nucleus, which does not have chromophores absorbing in the spectral region used for laser phototherapy (600-900 nm). One can find the original spectra (including the UV-to blue spectral region) (3-5), and in exact form analyzed by contemporary software, in (16). Below, we will also analyze the action spectrum for the increase in cell attachment to a glass matrix (17).
Figure 1 presents five action spectra in the red-to-near IR region for mammalian cells, and Table 1 provides the data of their deconvolution. Original experimental data (4, 5, 17) are presented here together with curve fitting and Lorentzian fitting (16). The mean-square deviation, R2, for every fitting is also shown in Table 1. At the best fitting, R2 =1. Spectra A and B present the stimulation of DNA synthesis rate in log-phase and plateau-phase cultures, respectively. Spectra C and D are the dependencies of stimulation of RNA synthesis rate in log- and plateau-phase cells. These four spectra were recorded using a monochromator MDR-2, with a halogen lamp with the power of 150 W placed in a parabolic reflector (4). The spectral full width at half maximum (FWHM) of the produced light was 14 nm (Figures 1A-D). Light intensity was kept constant (10 W/m2) by varying the voltage across the halogen lamp. The irradiation time was 10 s, and the dose was 100 J/m2. Spectrum E shows an increase in cell attachment to a glass matrix. In this case, the monochromator was a more advanced one, constructed in Institute of Spectroscopy of Russian Academy Science (17). Light parameters for recording of this spectrum were as follows:
I = 1.3 W/m2, t = 40 sec, D = 52 J/m2, FWHM 10 nm.
Figure 1. Action spectra in the region of 580-860 nm for (A) stimulation of DNA synthesis rate in log-phase and (B) plateau-phase cultures; (C) stimulation of RNA synthesis rate in log-phase and (D) plateau-phase cultures; (E) increase of cell attachment to a glass matrix. Experimental curves (, adapted from 4, 5, 17), curve fittings (solid line), and Lorentzian fittings (dashed line) are shown. Dose 100 J/m2 (A-D) or 52 J/m2 (E). Adapted from (16).
All five spectra in Figure 1 are characterized by four wide maxima, but the exact peak positions are different (Table 1). The largest differences in peak position can be seen in the near IR region above 800 nm. This peak appears at 812.5 nm in the spectrum A, between 827.5 and 830.7 nm in the spectra C, D, E, and at 846.0 nm, in the spectrum B.
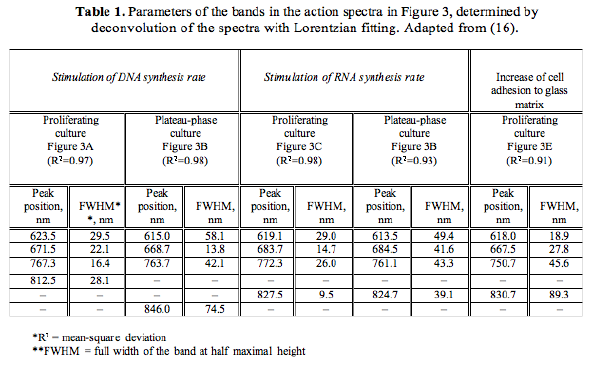
The maximum in spectra A-E in Figure 1 has peak positions from 750.7 to 772.3 nm (Table 1). In four spectra, this peak is between 761.1 and 772.3 nm, which could be one line in an absorption spectrum. An appearance of this maximum with a peak position at 750.7 nm in spectrum E could probably mirror another line in an absorption spectra.
The far-red maximum in the action spectra (Figure 1) has peak positions from 667.5 to 684.5 nm. These peak positions can be divided in to two groups: 667.5, 671.5, and 668.0 nm in one group, and 684.5 and 683.7 nm in the other (Table 1). The red maximum in the action spectra
(Figure 1) has peak positions from 613.5 to 623.5 nm (Table 1).
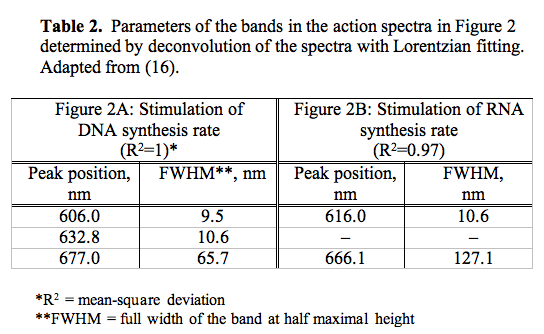
It should be noted that in an early action spectrum (3), a peak at 606 nm appeared together with a peak at 632.8 nm (Figure 2A, Table 2). These first two spectra for the stimulation of DNA and RNA synthesis rate were recorded from 570 to 650 nm, using filament lamps with a power of 20 and 90 W, and interference filters (3). With that setup we were not able to keep the intensity of the light equal at all wavelengths. This means that for a constant dose one was forced to use various irradiation times. In our case, the intensity was 1.5 and 0.3 W/m2, and the dose of 80 J/m2 was reached by irradiating the cells from 2 s to 4.5 min.
Figure 2. Action spectra in the region of 570-650 nm for the stimulation of (A) DNA and (B) RNA synthesis in log-phase cultures at D = 80 J/m2 under conditions where irradiation times were not kept constant. Experimental curves (
This was not a correct measurement of an action spectrum, but this first experiment showed several important features of the biostimulation phenomenon. First, not only He-Ne laser light at 632.8 nm causes "biostimulation", a similar result was achieved using noncoherent light of the same wavelength. Recall that in year 1982, the medical laser community believed that He-Ne laser radiation had magical beneficial properties. Secondly, after improving the equipment and comparing new action spectra (Figure 1, A-D) to the first spectra presented in Figure 2A, B, we understood that there should be a dependence on light intensity in the far-red region 650-680 nm. Speaking in photobiological terms, the reciprocity rule does not hold. According to the reciprocity (or Bunsen-Roscoe) rule, a photochemical reaction is directly proportional to the total energy dose, irrespective of the time over which this dose is delivered. However, the reason why in one spectrum (Figure 2A) two red bands appeared, is still obscure. One can only suppose that this is due to irradiation parameters, intensity and irradiation time. Solving this question requires new experiments.
Finding the absence of reciprocity lead us to perform a special experiment, where the dose was kept constant, but the irradiation time and intensity were varied. These data are presented here to draw attention once more to the threshold-type of behavior of the intensity-dependence that is still not understood, and is often not taken into account in experiments. It appeared that the red maximum in the action spectra is sensitive to light intensity (Figure 3), and that there exists a certain threshold to receive a stimulation effect (in our case, at 4-5 W/m2) (3). The maximum effect occurred near 8 W/m2 (irradiation time 10-12 s) (1, 3). The existence of the intensity threshold is especially important from a practical point of view (both in the laboratory and clinic) in deciding on the irradiation parameters. A similar type of curve was recorded at 454 nm for E. coli (10). Later, the invalidity of the reciprocity rule was shown for light at
= 632.8 nm when irradiating human fibroblasts (18) and E. coli (19). It is clear that the same type of measurements are needed for all bands in action spectra.
|
In the wavelength range used in our experiments, and important for phototherapy (600-860 nm), there are four "active" regions, but the peak positions are not exactly the same for all action spectra. The red band has a peak position between 613.5 and 623.5 nm (in one spectrum, at 606 nm); the far-red band has peak positions between 667.5 and 683.7 nm, and two near IR bands in the range of 750.7-772.3 nm and 812.5-846.0 nm.
|
3. INTERPRETATION of the ACTION SPECTRA: CYTOCHROME C OXIDASE is the PHOTOACCEPTOR MOLECULE
In the beginning of the 90's, the earlier action spectra (3-5, 17) were analyzed using all available spectroscopic literature data (9, 20), which allowed forming a suggestion about the chromophores involved. Bear in mind that the chromophores are the components of molecules that absorb the light.
The action spectra for DNA and RNA synthesis rate (3-5), and changes in the adhesion of cells to a glass matrix (17) without Lorentzian curve fitting (which was not done at that time) were used for a summation, and this generalized action spectrum is shown in Figure 3.
Figure 3. The generalized action spectrum (a summation of 5 action spectra) for the increased proliferation of HeLa cells for
Figure 3 shows that the generalized action spectrum for cell proliferation in the range of 580-860 nm consists of two series of doublet bands in the range 620-680 nm and 760-895 nm with well-pronounced maxima at 620, 680, 760 and 825 nm. In the violet-blue region, there is one maximum at 400 nm, with the edge of the envelope near 450 nm. Recall that in the wavelength range 310-500 nm, a maximum stimulating effect was obtained with a radiation dose one order of magnitude less than in the longer-wave spectral range (3, 4). This is noted in Figure 3 by Curves 1 and 2.
The bands in the action spectrum were identified in (20, and reviewed in 9) by analogy with the metal-ligand systems absorption spectra characteristic of this spectral range. The regions 400-450 nm and 620-680 nm are characterized by the bands pertaining to complexes with charge transfer in a metal-ligand system, and within 760-830 nm, these are d-d transitions in metals (21-23). The region 400-420 nm is typical of
 transitions in a porphyrin ring (24).
Comparative analysis of spectral data for transition metals and their complexes on one hand, and biomolecules participating in the regulation of cellular metabolism on the other, allowed us to suggest that multinuclear enzymes containing Cu(II) may be participating (9, 20). Analysis of the electron excitation transitions of participating molecules containing Cu(II) (25-27) showed that metal-ligand transitions in the range of 400-450 nm correspond to the Nimidasole
Comparing the lines of possible d-d transitions and charge-transfer complexes of Cu (24-28) with our action spectrum (Figure 3) allowed us to assume that the photoacceptor molecule has different types of centers containing Cu(II) in the ranges of 420-450 nm and 760-830 nm. In the range of 420-450 nm, this may be a combination of centers of Types I and II (for the characteristics of centers of Types I, II, and III, see reference 23) though a center of Type I may be present. At 330 nm, a center of Type III may be present, and in the range 760-820 nm centers of Types I and III coexist. Within 620-680 nm, there is a center of Type I and a combination of centers of different types is unlikely.
The above analysis allowed us to conclude that all bands in the action spectrum in Figure 3 may be related to cytochrome c oxidase (9, 20). The data of experiments of dichromatic irradiation and modification of light effects by adding various chemicals (1, 6-9) were taken into account as well in this analysis.
In eukaryotic cells, cytochrome c oxidase is the terminal enzyme of the respiratory chain, which mediates the transfer of electrons from cyt c to molecular oxygen (29). Ferrocytochrome c is oxidized, oxygen is reduced, and protons are pumped from the mitochondrial matrix to the cytosol. Free energy resulting from this redox chemistry is converted into an electrochemical potential across the inner membrane of the mitochondrion, which ultimately drives the production of ATP. Accordingly, cytochrome c oxidase plays a central role in the bioenergetics of the cell. The respiratory chains of eukaryotic cells are located in mitochondria.
Cytochrome c oxidase of mammalian cells is a large multicomponent membrane protein of considerable structural complexity. The high-resolution three-dimensional X-ray structure of cytochrome c oxidase of bovine heart (30-32) and Paracoccus denitrificans (33) were reported in 1995. These studies indicated that CuA is a binuclear copper center with an unexpected structure similar to a (2Fe-2S) type iron-sulfur center, in which the Fe ions and inorganic sulfur atoms are replaced with Cu ions and cysteine sulfur atoms, respectively. The O2 binding site contains heme a3 iron and CuB; there is no detectable bridging ligand between iron and copper atoms. Heme a is coordinated with two imidazoles of histidine residues. The fifth ligand of heme a3 is an imidazole, whereas CuB is coordinated by three imidazoles of histidine. Residues of two cysteins, two histidines, one methionine and one peptide carbonyl of a glutamate coordinate CuA (Cu-Cu) center (30). These reports of the crystal structures have opened a new era in cytochrome c oxidase research (34).
Figure 4. The schematic of intramolecular electron transfer into the redox-active reaction center a3-CuB of cytochrome c oxidase. Adapted from (31).
Electrons are transferred sequentially from water-soluble cytochrome c to the CuA of cytochrome c oxidase, then to heme a, and to the binuclear center a3-CuB (catalytic center of cytochrome c oxidase), where oxygen is reduced to water (Figure 4). Oxygen binds to the catalytic center, and is reduced to water through a series of short-lived elusive intermediates. Singular value decomposition analysis indicated the presence of at least seven intermediates (35). The best-characterized species are the ferrous-oxycomplex and peroxy species (36-38).
Generally speaking, cytochrome c oxidase can be fully oxidized (four redox active metal centers: CuA, CuB, irons in hemes a and a3, are in their common higher oxidation state; 3+ for iron and 2+ for copper), or fully reduced (four metal centers are in their common lower oxidation state; 2+ for iron and 1+ for copper). The partially reduced enzyme, usually called mixed-valence one, has some metal centers in their higher oxidation state, and the remainder in their lower oxidation state. There are also a number of forms of oxidized enzyme: fast enzyme (reacts relatively rapidly with cyanide), slow enzyme (reacts at about of 1% of the rate of the fast enzyme, also called resting enzyme), pulsed enzyme (obtained by reducing slow enzyme and oxidizing it with oxygen under conditions in which the production of H2O2 is avoided), oxygenated enzyme (subjected to a cycle of reduction and reoxidation under conditions in which H2O2 is produced) (38-40). These details are given to illustrate how complicated and controversial the overall picture of the function of cytochrome c oxidase still is.
Coming back to the comparative analysis of the action spectrum in Figure 2, and the spectroscopic data on cytochrome c oxidase cited above, it was suggested (9, 20) that the 820 nm band belongs mainly to oxidized CuA, the 760 nm band to reduced CuB, the 680 nm band to oxidized CuB, and the 620 band to reduced CuA (Figure 3). The 400-450 nm band is more likely to be the envelope of a few absorption bands in the range 350-500 nm (i.e., a superposition of several bands). The band with a maximum near 404-420 nm can be assigned to the oxidized heme, whereas the longer-wave edge of the envelope at 450 nm (due to its asymmetry), should evidently be assigned to the reduced CuB. The participation of the heme in the action spectra is confirmed by the optimal dose ratio (10 and 100 J/m2, respectively, for 404 and other visible region maxima, (3-5)). It should be noted that the Soret band of heme compounds (i.e., the band in the range of 400-420 nm) is more intense by an order of magnitude than the absorption bands of these compounds in the visible region (24). The weak band at 330 nm may belong to oxidized CuB. Thus, the bands at 330, 404-420, 680 and 825 nm can be attributed to a relatively oxidized form of cytochrome c oxidase; the edge of the blue-violet band at 450 nm and the distinct bands at 620 and 760 nm belong to a relatively reduced form of the enzyme. This analysis (9, 20) was performed before the three-dimensional X-ray structure of cytochrome c oxidase was reported (30-33). The results of our analysis do not have principal contradictions with data on the structure of cytochrome c oxidase by Tsukihara et al. (30, 31). It should be emphasized that every band in the absorption spectra is a result of the overlapping absorption of different chromophores, but in an action spectra not all of them may appear.
An analysis of the band shapes in the action spectra (Figure 3) and the line intensity ratios enabled us to conclude that cytochrome c oxidase cannot be considered as a primary photoreceptor when it is fully oxidized or fully reduced, but only when it is in one of the intermediate forms (i.e., partially reduced, or mixed valence enzyme) (9, 20).
Our suggestion that cytochrome c oxidase is the photoacceptor responsible for various cellular responses connected with light therapy in the red-to-near IR region (9) was later conformed by the work of Pastore et al. (41), Wong-Riley et al. (11, 42), and Eells et al. (43, 44), as well as by our own spectroscopic work described below in the next Section (45, 46).
|
A number of other kinds of experiments (dose and intensity dependences for various wavelengths, dichromatic irradiation in various ways, modification of irradiation experiments by specific chemicals, and others) were performed (reviews: 1, 6, 9, 47, 48). The results of all these experiments, together with action spectroscopy experiments, which were summarized briefly above, allowed the conclusion that cytochrome c oxidase could be a universal photoacceptor for eukaryotic cells.
|
4. COMPARISON of ACTION and ABSORPTION SPECTRA
Insofar as an action spectrum mirrors the absorption spectrum of the molecule that absorbs the light and is responsible for the action spectrum recorded, an important step in identification of this photoabsorbing molecule is the comparison of action and absorption spectra.
Recording an absorption spectrum of a cellular monolayer or individual cell is not an easy task, due to weak absorption and low concentration of chromophores. The absorption spectra of individual cells were recorded years ago up to 700 nm with the aim of identifying respiratory chain carriers (49, 50). The absorption spectrum of 8 parallel monolayers of human fibroblasts in the red-to-near IR region was recorded using a commercial double beam spectrophotometer (51). The absorption spectrum of whole cells in the visible region was found to be qualitatively similar to that of isolated mitochondria (49). The extension of optical measurements from the visible spectral range to the far-red and near IR regions (650-1000 nm) was undertaken late in the seventies for the purpose of monitoring the redox behavior of cytochrome c oxidase in vivo. These studies led to the discovery of a "near IR window" into the body, and the development of near IR spectroscopy for monitoring tissue oxygenation (52-54).
For recording the absorption of one cellular layer with the aim of studying the radiation-induced changes in the absorption of cell chromophores, a multichannel registration method was developed (55, 56). Figure 5 presents the absorption spectra (A-C), and the same spectra after the irradiation at 830 nm (A1-C1), as well as two action spectra (D, E) for comparison.
Figure 5. Absorption spectra of HeLa cell monolayer: (A-C) prior to and (A1-C1) after irradiation at 830 nm. A, A1 (closed cuvette), B, B1 (open cuvette), C, C1 (air-dry monolayer). Original spectrum, curve fitting (solid lines) and Lorentzian fitting (dashed lines) are shown (adapted from (57)).
Action spectra for: (D) stimulation of DNA synthesis and (E) stimulation of HeLa cell adhesion to a glass matrix, measured respectively 1.5 h after irradiation of HeLa cell monolayer (D = 100 J/m2, t = 10 s, I = 10 W/m2) and 30 min after irradiation of HeLa cell suspension (D = 52 J/m2,= 40 s, I = 1.3 W/m2). Experimental curves (
The cellular monolayers for all of our experiments were grown in closed cuvettes. The first series of experiments on the recording of the absorption spectra prior to and after irradiation were conducted with the cuvettes remaining closed. A typical spectrum recorded under these conditions prior to irradiation is presented in Figure 5A, and that recorded after irradiation, in Figure 5A1. Spectrum A is characterized by a strong absorption in the region of 730-850 nm (the bands resolved by the Lorentzian curve fitting method are at 736, 754, 773, and 797 nm, Table 3), and low absorption near 600 nm (a single band at 630 nm) and above 800 nm (the peaks at 830 and 874 nm are resolved, Table 3). This is the spectrum of the cells with the most strongly reduced cytochrome c oxidase in our experiments. The irradiation of the cells causes the following changes in the peak positions in this spectrum, as evident from spectrum A1 presented in Figure 3 and in Table 3. The low-height band is resolved in the red region at 634 nm. A single strong peak is resolved at 756 nm. The three bands with the peak positions at 807, 834, and 867 nm characterize the region of wavelengths over 800 nm. As a whole, both of these spectra, A and A1, have dominating bands in the region of 750-770 nm.
A typical spectrum of the cells with the most strongly oxidized cytochrome c oxidase in our experiments is presented in Figure 5C. In this case, the cuvettes were opened for 30 min to let the cellular monolayer dry in the air. The red band in this spectrum is resolved at 616 nm, and the far-red bands, at 665 and 681 nm. The NIR region is characterized by weak bands at 712, 730 and 762 nm, and by two strong bands at 813 and 872 nm (Table 3). The irradiation of this monolayer caused no changes in the absorption spectrum, as shown in Figure 5 (spectrum C1) and Table 3. This is not an unexpected finding, because the respiratory chains do not function in dry cells. This experiment was needed to record the spectrum of the cells with oxidized cytochrome c oxidase. As a whole, spectrum C in Figure 5 was characterized by strong absorption bands in the red region, as well as in the NIR region of wavelengths over 800 nm, and extremely weak bands in the region of 750-770 nm. A comparison between spectra A and C allows us to conclude that the band at 750-770 nm is characteristic of relatively reduced photoacceptor molecules, and the band at 650-680 nm, as well as that at 800-870 nm, of oxidized ones.
In the third series of experiments, the cuvettes were held open for 5 min prior to taking measurements. The absorption spectra of the cells in these conditions are typically characterized by a band at 633 nm in the red region, and the bands with the peak position at 666, 711, 730, 767, 791, and 880 nm in the far-red and NIR regions (Figure 5, Table 3). The irradiation of these cells causes significant changes in the absorption spectra in all spectral regions (spectrum B1 in Figure 5). The band at 750-800 nm becomes dominant in the spectra of the irradiated cells. There are no bands resolved at wavelengths over 800 nm, as well as in the region of 600-630 nm. Spectrum B1 features bands with the peak positions at 661, 681, 739, 765, and 788 nm (Table 3).
Therefore, we performed a set of experiments to measure the absorption spectra of cultured cells the in region ~600-860 nm, and compared these spectra with action spectra recorded already. Then, we had to check if there were any changes in the absorption spectra due to the irradiation.
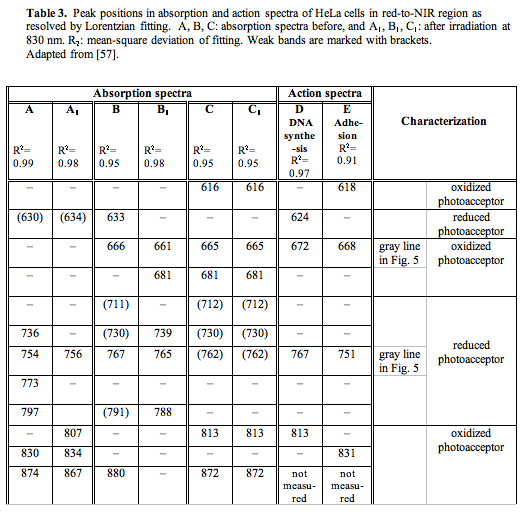
For quantitative characterization purposes, as well as for comparison between the recorded absorption spectra, we decided to use intensity ratios between certain absorption bands. The use of spectral band intensity ratios to analyze various spectra is not a new issue for spectroscopy in general (58), but to our knowledge, it has not been used in the absorption spectroscopy of isolated mitochondria or living cells. The calculation of the intensity ratios was shown to provide benefits for the exact comparison of spectra in the IR region (58). We used the band present in all absorption spectra near 760 nm (exactly at 754, 756, 767, 765, and 762 nm) (Table 3) as a characteristic band for the relatively reduced photoacceptor. The band used by us to characterize the relatively oxidized photoacceptor was the one near 665 nm (exactly at 666, 661, and 665 nm) in spectra B, B1, C, C1 (Table 3). This band is so weak that it could not be resolved by the Lorentzian fitting method in spectra A and A1, belonging to the most strongly reduced photoacceptor in our experiments. For this reason, we used in our intensity calculations for spectra A and A1 absorption on the curve fitting level at 665 nm. The gray vertical lines in Figure 5 mark the bands chosen. The intensity ratio I760/I665 was calculated to characterize every spectrum. In these simple calculations, we used only the peak intensities (peak heights), and not the integral intensities (peak areas) that are certainly needed for further developments. In the case of equal concentrations of the reduced and oxidized forms of the photoacceptor molecule, the ratio I760/I665 should be equal to unity. When the reduced forms prevail, the ratio I760/I665 is greater than unity, and it is less than unity in cases where the oxidized forms dominate. Recall that the internal electron transfer within the cytochrome c oxidase molecule causes the reduction of molecular oxygen via several transient intermediates of various redox states (38, 59-61).
The magnitude of the I760/I665 criterion is 9.5 for spectrum A (Figure 5), 1.0 for spectrum B, and 0.36 for spectrum C. By this criterion, irradiation of the cells, whose spectrum is marked by A (I760/I665 = 9.5) causes the reduction of the absorbing molecule (I760/I665 for spectrum A1 is equal to 16). Irradiation of the cells characterized by spectrum B also causes the reduction of the photoacceptor, as evidenced by the increase of the I760/I665 ratio from 1.0 to 2.5 in spectrum B1. In the spectrum of the cells with initially more reduced photoacceptor (spectrum A), irradiation causes reduction to a lesser extent (16/9.5 = 1.7) than in that of the cells with initially less reduced photoacceptor (spectrum B). The intensity ratio in this case is 2.5/1 = 2.5).
Figure 5 also presents two action spectra, one for the stimulation of DNA synthesis in our HeLa cells (D), and the other for the stimulation of the attachment of the HeLa cells to a glass matrix (E). A comparison of peak positions in the absorption spectra with these two action spectra
(Table 3) shows a similarity between them.
The oxidized form of cytochrome c oxidase has a broad absorption band above 800 nm that is centered at 830 nm (62). CuA, a dimeric copper complex with four ligands, is responsible for 77% of the absorbency at 810-820 nm, while the contribution of heme a and heme a3/CuB is 18 and 5%, respectively (59). Due to the domination of the strong absorption of CuA in this region, weak underlying lines are masked in the absorption spectrum of cytochrome c oxidase (63). A distance of 33.5 nm between the minimal and maximal peak positions in the spectra (Table 1) is too long to be explained by measurement error (e.g., FWHM of irradiating light 10 or 14 nm). Quite probably, different lines in the absorption spectra of intermediates of cytochrome c oxidase appear in the action spectra. This suggestion, however, requires further experimental proof.
A study of the near-IR absorption spectra of membrane-bound cytochrome c oxidase at low temperature shows that there are overlapping traces covering the full wavelength range from 680 to 870 nm (64-66). Flash photolysis causes the formation of a mixed valence compound with a peak at 740-750 nm, which supposedly could belong to invisible copper (CuB) (67). A band at ~785 nm is present in fully reduced, unliganded, five coordinated ferrous heme a32+(68). The addition of carbon monoxide to the reduced enzyme causes a blue shift from 785 nm to 760 nm in the difference spectrum, and the photodissociation of CO results in a reversion of the band from 760 to 784 nm (63).
In the wavelength range 670-680 nm, there are no absorption bands of cytochrome c oxidase intermediates recorded so far. A small absorption band belonging to an intermediate (compound A) has been recorded at ~660 nm (59). The appearance of the 655-nm absorption band suggests that CuB is oxidized and participating in a spin-coupled state (69). It is suggested that the 655-nm feature may arise from a charge transfer band of ferric high-spin heme a3, which is modulated by the redox state of CuB. The 655-nm band disappears as the binuclear center is reduced (70). Quite probably, this is one line in the absorption spectra of cytochrome c oxidase and/or its intermediates.
It is well known that reduced cytochrome c oxidase has a peak at 605 nm, and this peak has been recorded both in mitochondria and whole cells (71). For membrane-bound cytochrome c oxidase, this peak can be red-shifted ~10 nm, as compared to solubilized enzyme (69). Some isospectral peroxy intermediates have a peak at ~607 nm in their absorption spectra (59). The absorption of this region is 75% due to low spin heme a, and 25% by high spin heme a3. However, a definite contribution of CuA at ~615 nm has been suggested as well (72).
The same technique of absorption measurements described in (57) was used to study oxidation or reduction of the photoacceptor under irradiation at
= 632.8 nm as a function of dose (46).
|
The comparison of action spectra connected with reactions in the cellular nucleus, and the absorption spectra of cellular monolayers at (600-860 nm allow one to conclude that by peak positions, these two groups of spectra may belong to the same molecule.
|
5. MITOCHONDRIAL SIGNALING: HOW the LIGHT-GENERATED SIGNAL in MITOCHONDRIA can INFLUENCE CELLULAR METABOLISM
We know from the action spectra that the DNA and RNA synthesis rate is influenced by irradiation (Section 2), and we know that the photoacceptor (tentatively cytochrome c oxidase) is located in mitochondria (Section 3). There is an important question left: how the signal generated by the light quanta in cytochrome c oxidase is transduced to the nucleus. The answer is that mitochondrial retrograde signaling quite probable is responsible for this. Interested readers are guided to a recent review (73), however, below is a short summary.
Recent work has uncovered an impressive number of extra mitochondrial factors that regulate the expression of nuclear genes for mitochondrial proteins. However, relatively little is known about how mitochondria send signals to the nucleus, and how the nucleus controls the expression of individual genes. One pathway of communication in cells from mitochondria to the nucleus that influences many cellular activities under both normal and pathophysiological conditions is mitochondrial retrograde signaling (74, 75). This recently discovered signaling is an opposite signaling pathway to a common and well defined pathway transforming information from the nucleus and cytoplasm to the mitochondria. Mitochondrial retrograde signaling sends information back to the nucleus about changes in the functional state of the mitochondria.
The existence of a cellular signaling pathway: mitochondria
Figure 6 presents a putative schematic of mitochondrial retrograde signaling activated by radiation in the visible and IR-A regions. This schematic was first proposed in 1988 (8, review: 47) and later supplemented with new details according to new experimental data (1, 9). Some new modifications are also included in the present schematic in Figure 6.
Mitochondrial retrograde signaling was initially defined by an altered mitochondrial membrane potential
 (74). Later, other characteristics like changes in the concentration of mitochondrial ROS, Ca2+, and nitric oxide, as well as changes in fission-fusion homeostasis of mitochondria (75) were introduced. Changes in these characteristics under the irradiation with light at different wavelengths follow a cyclic pattern. First, a stimulation characterized by a threshold and phase of increase occurs. After a strict maximum and a phase of decrease, the control level is reached. As an example, at the level of a single cell and during real-time recording, a maximal increase in mitochondrial membrane potential (30% of its basal value) was observed at 2 min after a 15 s irradiation at 647 nm. Then decreased gradually to the basal level, which was reached 4 min later (78). Experimental data about the modulation of elements of mitochondrial retrograde signaling by irradiation are reviewed in (73).
Irradiation of mammalian cells causes an upregulation of various genes (78). The upregulation of genes, and the increase in DNA and RNA synthesis rate (Sections 1, 2) are marked in Figure 6 in the nucleus of the cell. The cDNA microarray technique was used for human fibroblasts irradiated at 628 nm (79). Of the 9982 gene expression profiles studied, 111 genes in 10 function categories were upregulated. Note that among these 10 function categories, 7 of them were directly or indirectly involved in cell proliferation. The other 3 function categories upregulated were genes related to transcription factors, immune/inflammation, and cytokines as well as some genes not identified (79).
It should be noted that the responses of mammalian cells to visible and near IR radiation, as well as the sensitivity of the mitochondrial respiratory chain components to this radiation have never gained as much serious attention by photobiologists, as have the functional photoacceptors, such as chlorophyll and rhodopsin. However, fragmentary knowledge gathered so far forces one to ask whether the photosensitivity of some enzymes of the mitochondrial respiratory chain may have a physiological significance in spite of the complete adaptation of living systems to photons as a natural external factor.
|
There is every reason to believe, on the basis of experimental data gathered so far, that mitochondrial retrograde signaling, a recently discovered cellular signaling pathway, functions also in irradiated cells. Modulation of retrograde mitochondrial signaling elements like , (ROS)m, (Ca2+)m in irradiated cells is rather well documented (review: 73). Also, the responses to irradiation occurring in the nucleus (i.e., increase in DNA and RNA synthesis rate, and expression of genes of various function categories) are definitely documented. However, the pathways of light signal transduction between these two ends needs further investigation.
|
6. CONCLUSIONS
1. The similarity of action spectra for different cellular responses suggests that the photoacceptor is the same for these responses. For the responses reported here, the photoacceptor appears to be cytochrome c oxidase. Recall that it was suggested in 1981 that photosensitivity might be a common mitochondrial property in higher animals, and could have physiological significance under certain conditions, e.g., exposure to orange-red light, and high ADP levels (80).
2. Based on these action spectra, various wavelengths can be used for low level light therapy, i.e., those around 404, 620, 680, 760, and 820 nm.
3. The existence of the action spectra for biochemical processes occurring in various cellular organelles (nucleus, plasma membrane) assume the existence of cellular signaling pathways between a photoacceptor in the mitochondria and the nucleus, as well as between photoacceptor and the plasma membrane.
4. It is believed that the "mitochondrial mechanism" of low level light therapy works in all types of cells containing mitochondria (1).
REFERENCES
1. T. Karu (2007). "Ten Lectures on Basic Science of Laser Phototherapy" Prima Books AB, Grngesberg (Sweden).
2. Hartmann, K.M. (1983). Action spectroscopy, in W. Hoppe, W. Lohmann, H. Marke, H. Ziegler (Eds.). The Biophysics, Springier: Heidelberg, Ch. 3.2.7. pp.115-144.
3. Karu, T.I., Kalendo, G.S., Letokhov, V.S. and Lobko V.V. (1982). Biostimulation of HeLa cells by low intensity visible light. Nuovo Cimento D, 1, 828-840.
4. Karu, T.I., Kalendo, G.S., Letokhov, V.S., and Lobko V.V. (1984). Biostimulation of HeLa cells by low-intensity visible light. II. Stimulation of DNA and RNA synthesis in a wide spectral range. Nuovo Cimento D, 3, 308-318.
5. Karu, T.I., Kalendo, G.S., Letokhov, V.S., and Lobko V.V. (1984). Biostimulation of HeLa cells by low intensity visible light. III. Stimulation of nucleic acid synthesis in plateau phase cells. Nuovo Cimento D, 3, 319-325.
6. Karu T.I. (1987). Photobiological fundamentals of low-power laser therapy. IEEE J. Quantum Electronics, QE-23, 1703-1717.
7. Karu, T.I., Letokhov, V.S., and Lobko V.V. (1985). Biostimulation of HeLa cells by low-intensity visible light. IV. Dichromatic irradiation. Nuovo Cimento D, 5, 483-496.
8. Karu T.I. (1988). Molecular mechanism of the therapeutic effect of low-intensity laser radiation. Lasers Life Sci., 2, 53-74.
9. Karu T.I. (1999). Primary and secondary mechanisms of action of visible-to-near IR radiation on cells. J. Photochem. Photobiol. B: Biology, 49, 1-17.
10. Tiphlova, O. and Karu, T.(1991). Action of low-intensity laser radiation on Escherichia coli. CRC Critical Rev. Biomed. Eng., 18, 387-412.
11. Wong-Riley, M.T.T., Liang, H.L. Eells, J.T., Chance B., Henry, M.M., Buchmann, E., Kane, M., and Whelan, H.T. (2005). Photobiomodulation directly benefits primary neurons functionally inactivated by toxins: Role of cytochrome c oxidase. J. Biol. Chem., 280, 4761-4771.
12. Szacilowski, K., Macyk, W. Drzewiecka-Matuszek, A., Brindell, M., and Stochel, G. (2005). Bioinorgranic photochemistry: frontiers and mechanisms. Chem. Rev. 105, 2647-2694.
13. Hug, D.N. (1978). The activation of enzymes with light. In: Photochem. Photobiol. Rev. Ed. by K. Smith, New York, London: Plenum Press, vol. 3, pp. 1-33.
14. Hug, D.N. and Hunter, Y.K. (1991). Photomodulation of enzymes. J. Photochem. Photobiol. B: Biol. 10, 3-22.
15. Jagger, J. (2004). Personal reflections on monochromators and action spectra for photoreactivation. J. Photochem. Photobiol. B: Biol., 73, 109-114.
16. Karu, T.I. and Kolyakov, S.F. (2005). Exact action spectra for cellular responses relevant to phototherapy. Photomed. Laser Surg. 23, 355-361.
17. Karu, T.I., Pyatibrat, L.V., Kalendo, G.S., and Esenaliev, R.O. (1996). Effects of monochromatic low-intensity light and laser irradiation on adhesion of HeLa cells in vitro. Lasers Surg. Med., 18, 171-177.
18. van Breugel, H.H.F.I. and Dop Bar, P.R. (1992). Power density and exposure time of He-Ne laser irradiation are more important than total energy dose in photobiomodulation of human fibroblasts in vitro. Laser Surg. Med., 12, 528-537.
19. Karu, T., Tiphlova, O., Esenaliev, R., and Letokhov, V. (1994). Two different mechanisms of low-intensity laser photobiological effects on Escherichia coli. J. Photochem. Photobiol. B: Biology, 24, 155-161.
20. Karu, T.I. and Afanasyeva, N.I. (1995). Chytochrome oxidase as primary photoacceptor for cultured cells in visible and near IR regions. Doklady Akad. Nauk (Moscow) 342, 693-695.
21. Wilkinson, G., Gillard, R.D. and McCleverty, J.A., Eds. (1987). Comprehensive Coordination Chemistry. Oxford: Pergamon Press, vol. 1-7.
22. Siegel, H. Ed. (1971-1981). Metal Ions in Biological Systems. New York, Basel: M. Dekker, v. 1-13.
23. Hughes, M. (1987). Coordination Compounds in Biology. In: Comprehensive Coordination Chemistry. Ed. by G. Wilkinson, R.D.Gilland and J.A. McCleverty, Oxford: Pergamon Press, vol. 6, pp. 541-753.
24. Gouterman, M. (1978). Optical spectra and electronic structure of porphyrins and related rings. In: The Porphyrins. Ed. by D. Dolphin. New York: Acad. Press, v. 3, pp. 1-16.
25. Hathaway, B.J. (1987). Copper. In: Comprehensive Coordination Chemistry. Ed. by G. Wilkinson, R.D. Gillard and J.A. McCleverty. Oxford: Pergamon Press, vol. 5, pp.534-774.
26. Lontie, R., Ed. (1984). Copper Proteins and Copper Enzymes. Boca Raton: CRC Press, v. 1-3.
27. Spiro, G., Ed. (1981). Copper Proteins. New York: Wiley Intersci.
28. Karlin, D. and Zubieta, J., Eds. (1983). Copper Coordination Chemistry. New York: Acad. Press.
29. Brunori, M. and Chance, B., Eds. (1988). Cytochrome Oxidase: Structure, Function and Physiopathology. Ann. N.Y. Acad. Sci., v. 550.
30. Tsukihara, T., Aoyma, H., Yamashita, E., Tomizaki, T., Yamaguchi, H., Shinzawa-Itoh, K., Nakashima, R., Yaono, R., and Yoshikawa, S. (1995). Structures of metal sites of oxidized bovine heart cytochrome c oxidase at 2.8 Å. Science 269, 1069-1074.
31. Tsukihara, T., Aoyama, H., Yamashita, E., Tomizaki, T., Yamaguchi, H., Shinzawa-Itoh, K., Nakashima, R., Yaono, R., and Yoshikawa, S. (1996). The whole structure of the 13-subunit oxidized cytochrome c oxidase at 2.8 Å. Science 272, 1136-1144.
32. Gennis, R. and Ferguson-Miller, S. (1995). Structure of cytochrome c oxidase, energy generator of aerobic life. Science 269, 1063-1064.
33. Iwata, S., Ostermeier, C., Ludwig, B., and Michel, H. (1995). Structure of 2.8 Å resolution of cytochrome c oxidase from Paracoccus denitrificans. Nature 376, 660-669.
34. Yoshikawa, S. (1997). Beef heart cytochrome c oxidase. Curr. Opin. Struct. Biol. 7, 574-579.
35. Sucheta, A., Georgiadis, K.E., and Einarsdottir, O. (1997). Mechanism of cytochrome c oxidase-catalyzed reduction of dioxygen to water: evidence for peroxy and ferryl intermediates at room temperature. Biochemistry 36, 554-565.
36. Babcock, G. T. and Wikström, M. (1992). Oxygen activation and the conservation of energy in cell respiration. Nature 356, 301-309.
37. Verkhovsky, M.I., Morgan, J.E. and Wikström, M. (1996). Redox transitions between oxygen intermediates in cytochrome c oxidase. Proc. Acad. Sci. USA 93, 12235-12339.
38. Brunori, M., Giuffre, A., and Sarti, P. (2005). Cytochrome c oxidase, ligands and electrons. J. Inorg. Biochem. 99, 324-336.
39. Capaldi, R.A. (1990). Structure and function of cytochrome c oxidase. Annu. Rev. Biochem. 59, 569-596.
40. Palmer, G. (1993). Current issues in the chemistry of cytochrome c oxidase. J. Bioenerg. Biomembr. 25, 145-151.
41. Pastore, D., Greco, M., and Passarella, S. (2000). Specific helium-neon laser sensitivity of the purified cytochrome c oxidase. Int. J. Rad. Biol. 76, 863-870.
42. Wong-Riley, M.T., Bai, X., Buchman, E. and Whelan, H.T. (2001). Light-emitting diode treatment reverses the effect of TTX on cytochrome c oxidase in neurons. Neuroreport 12, 3033-3037.
43. Eells, J.T., Henry, M.M., Summerfelt, P., Wong-Riley, M.T., Buchmann, E.V., Kane, M., Whelan, N.T., and Whelan, H.T. (2003). Therapeutic photobiomodulation for methanol-induced retinal toxicity. Proc. Natl. Acad. Sci. USA 100, 3439-3444.
44. Eells, J., Wong-Riley, M.T., VerHoeve, J., Henry, M., Buchman, E.V., Kane, M.P., Gould, L.J., Das, R., Jett, M., Hodgson, B.D., Margolis, D., and Whelan, H.T. (2004). Mitochondrial signal introduction in accelerated wound and retinal healing by near-infrared light therapy. Mitochondrion 4, 559-567.
45. Karu, T.I., Pyatibrat, L.V. Kolyakov, S.F., and Afanasyeva, N.I. (2005). Absorption measurements of a cell monolayer relevant to phototherapy: reduction of cytochrome c oxidase under near IR radiation. Photochem. Photobiol. B: Biol. 81, 98-106.
46. Karu, T.I., Pyatibrat, L.V., Kolyakov, S., and Afanasyeva, N.I. (2008). Absorption measurements of cell monolayers relevant to mechanisms of laser phototherapy: reduction or oxidation of cytochrome c oxidase under laser radiation at 632.8 nm. Photomedicine and Laser Surgery, 26 (in the press). 47. Karu, T. (1989). Photobiology of low-power laser effects. Health Phys. 56, 691-704.
48. Karu, T.I. (1989). Photobiology of Low-Power Laser Therapy. Chur, London: Harwood Acad. Publ.
49. Chance, B. and Hess, B. (1959). Spectroscopic evidence of metabolic control. Science 129, 700-708.
50. Nicholls, P. and Elliot, W.B. (1974). The cytochromes. In: Iron in Biochemistry and Medicine. Ed by A. Jacobs and M. Worwood, London, New York: Acad. Press, pp. 221-272.
51. van Breugel, H.H. and Dop Bär, P.R. (1992). Power density and exposure time of He-Ne laser irradiation are more important than total energy dose in photo-biomodulation of human fibroblasts in vitro. Lasers Surg. Med. 12, 528-537.
52. Jöbsis, F.F. (1977). Noninvasive infra-red monitoring of cerebral and myocardial oxygen sufficiency and circulating parameters. Science 198, 1264-1267.
53. Jöbsis-vander Vliet, F.F. (1999). Discovery of the near-infrared window into the body and the early development of near-infrared specroscopy. J. Biomed. Opt. 4, 392-396.
54. Cooper, C. and Springett, I.R. (1997). Measurement of cytochrome c oxidase and mitochondrial energetics by near infrared spectroscopy. Phil. Trans. R. Soc. Lond. B. 352, 669-676.
55. Karu, T.I., Afanasyeva, N.I., Kolyakov, S.F., and Pyatibrat, L.V. (1998). Change in absorption spectrum of a monolayer of live cells under low-intensity laser irradiation. Dokl. Akad. Nauk. (Moscow) 360, 267-270.
56. Karu, T. I., Afanasyeva, N.I., Kolyakov, S.F., Pyatibrat, L.V., and Welser, L. (2001). Changes in absorbance of monolayer of living cells induced by laser radiation at 633, 670, and 820 nm. IEEE Select. Topics Quantum Electr. 7, 982-988.
57. Karu, T.I., Pyatibrat, L.V. Kolyakov, S.F., and Afanasyeva, N.I. (2005). Absorption measurements of a cell monolayer relevant to phototherapy: reduction of cytochrome c oxidase under near IR radiation. Photochem. Photobiol. B: Biol. 81, 98-106.
58. Smith, B. (1986). Fundamentals of Fourier Transform Infrared Spectroscopy. New York: CRC Press.
59. Szundi, I., Liao, G.-L., and Einarsdottir, O. (2001). Near-infrared time-resolved optical absorption studies of the reaction of fully reduced cytochrome c oxidase with dioxygen. Biochemistry 40, 2332-2339.
60. Szundi, I., Cappuccio, J. and Einarsdottir, O. (2004). Amplitude analysis of single-wavelength time-dependent absorption data does not support the conventional sequential mechanism for the reduction of dioxygen to water catalyzed by bovine heart cytochrome c oxidase. Biochemistry 43, 15746-15758.
61. Richter, O.-M. and Ludwig, B. (2003). Cytochrome c oxidase - structure, function, and physiology of a redox-driven molecular machine. Rev. Physiol. Biochem. Pharmacol. 147, 47-74.
62. Griffiths, D.E. and Wharton, D.C. (1961). Studies of the electron transport system. XXXV. Purification and properties of cytochrome oxidase. J. Biol. Chem., 236, 1850-1856.
63. Rich, P.R., Moody, A.J., and Ingledew, W.J. (1992). Detection of near infra-red absorption band of ferrohaem a3 in cytochrome c oxidase. FEBS Lett. 305, 171-173.
64. Shaw, R.W., Hansen, R.E., and Beinert, H. (1979). The oxygen reactions of reduced cytochrome c oxidase. Position of a form with an unusual EPR signal in the sequence of early intermediates. Biochim. Biophys. Acta 548, 386-396.
65. Beinert, H., Hansen, R.E., and Hartzell, C.R. (1976). Kinetic studies on cytochrome c oxidase by combined epr and reflectance spectroscopy after rapid freezing. Biochim. Biophys. Acta 423, 339-335.
66. Beinert, H., Shaw, R.W., Hansen, R.E., and Hartzell, C.R. (1980). Studies on the origin of the near-infrared (800-900) absorption of cytochrome c oxidase. Biochim. Biophys. Acta 591, 458-470.
67. Chance, B. and Leigh, J.S. (1977). Oxygen intermediates and mixed valence states of cytochrome c oxidase: infrared absorption difference spectra of compounds A, B, and C of cytochrome oxidase and oxygen. Proc. Natl. Acad. Sci. USA, 74, 4777-4780.
68. Einarsdottir, O., Georgiadis, K.E., and Dawes, T.D. (1992). Evidence for a band III analogue in the near-infrared absorption spectra of cytochrome c oxidase. Biochem. Biophys. Res. Comm., 184, 1035-1041.
69. Clore, M. (1980). Characterization of the intermediates in the reaction of membrane-bound mixed-valence-state cytochrome oxidase with oxygen at low temperatures by optical spectroscopy in the visible region. Biochem. J. 187, 617-622.
70. Mitchell, R., Mitchell, P., and Rich, P. (1991). The assignment of 655 nm spectral band of cytochrome c oxidase. FEBS Lett., 280, 321-324.
71. Chance, B., and Hess, B. (1959). Spectroscopic evidence of metabolic control. Science, 129, 700-708.
72. Brunori, M., Antonini, E., and Wilson, M.T. (1981). Cytochrome c oxidase: an overview of recent work. in: H. Siegel, (Ed.). Metal Ions in Biological Systems M. Dekker: N.Y., Basel, vol. 13, pp. 187-228.
73. Karu, T. (2008). Mitochondrial signaling in mammalian cells activated by red and near IR radiation. Photochem. Photobiol. 84, 1091-1099.
74. Butow, R.A. and N.G. Avadhani (2004) Mitochondrial signaling: the retrograde response. Mol. Cell. 14, 1-15.
75. Ryan, M.T. and N.J. Hoogenraad (2007) Mitochondrial-nuclear communications. Annu. Rev. Biochem. 76, 701-722.
76. Karu, T., Pyatibrat, L. and Afanasyeva, N. (2004). A novel mitochondrial signaling pathway activated by visible-to-near infrared radiation. Photochem. Photobiol. 80, 366-372.
77. Schroeder, P., C. Pohl, C. Calles, C. Marks, S. Wild, and J. Krutmann. (2007). Cellular response to infrared radiation involves retrograde mitochondrial signaling. Free Rad. Biol. Med. 43, 128-135.
78. Zhang, Y., Song, S., Fong, C.-C., Tsang, C.-H., Yang, Z., and Yang, M. (2003). cDNA microarray analysis of gene expression profiles in human fibroblast cells irradiated with red light. J. Invest. Dermatol. 120, 849-857.
79. Alexandratou, E., D. Yova, P. Handris, D. Kletsas and S. Loukas (2002) Human fibroblast alterations induced by low power laser irradiation at the single cell level using confocal microscopy. Photochem. Photobiol. Sci. 1, 547-552.
80. Kato, M., K. Sinizawa, and S. Yoshikawa (1981) Cytochrome c oxidase is a possible photoacceptor in mitochondria. Photochem. Photobiophys. 2, 263-269.
10/14/08