APPLICATIONS OF BIOLUMINESCENCE
Cell Based Assays and Imaging
Yoshihiro Ohmiya
Biomedical Research Institute
National Institute of Advanced Industrial Science and Technology (AIST)
Tsukuba, 305-8566, Japan
y-ohmiya@aist.go.jp
Bioluminescence is a unique light source based on the luciferin-luciferase reaction, and their luciferases are good reporter enzymes in the field of bioresearch. Indeed, bioluminescence reporters are widely used in various aspects of biological functions, such as gene expression, post-translational modification, and protein-protein interaction in cell based assays (Wilson and Hastings, 1998; Nakajima and Ohmiya, 2010). Advanced luciferase technologies also permit the quantitative visualization of gene expression at single-cell resolution by imaging its luminescence in real-time using a highly sensitive charged-coupled device (CCD) camera. Although fluorescence imaging techniques that use fluorescent proteins (e.g., green fluorescent protein (GFP) and its derivatives) as probes have greatly contributed to the advancement of cell biology studies, bioluminescence imaging is emerging as a new and sensitive approach for understanding cell physiology (Greer and Szalay, 2002; Roda et al., 2009).
Table 1 summarises the characteristic properties of bioluminescence systems based on commercially available luciferases from luminescent beetles, sea pansy, copepods, and ostracods. Commercially available luciferins comprise only three types: firefly D-luciferin, coelenterazine, and Cypridina luciferin, although dinoflagellate and Latia luciferins have been identified. In light-emitting reactions, the emission maxima of firefly D-luciferin-type, coelenterazine-type, and Cypridina luciferin-type bioluminescence are found at around 535–630 nm, 460–480 nm, and 460 nm, respectively. These values correspond to the fluorescence emission maxima of their oxyluciferins. The mass of luciferases vary widely (20–62 kDa), and their structures, which originate from phylogenetically distant systems, belong to different superfamilies. Cypridina, Gaussia, and Metridia luciferases (CLuc, GLuc, and MetLuc, respectively) are secreted enzymes. The luciferin-luciferase reaction is triggered by adding luciferin, although the bioluminescence in firefly, click beetle, and railroad worm needs ATP and magnesium ions as cofactors.
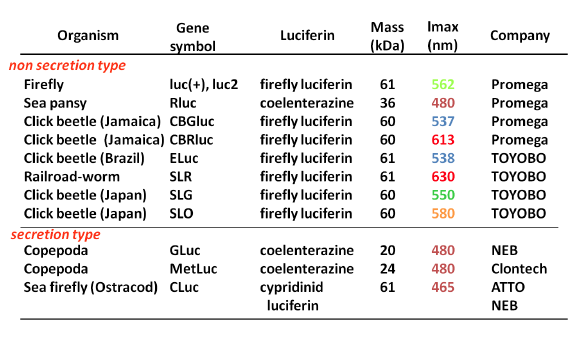
Table 1. Summary of Commercialized Luciferase Genes and Their Characteristic Properties. (see: Nakajima and Ohmiya, 2010)
Luciferase Reporter Assay
Cell based assay systems using reporter enzymes are used widely to study promoters, interactions between promoters and transcription factors, signal transduction, and other cellular activities. Cell based assays are also applied to drug screening both in vitro and in vivo. Of the reporter genes known to date, luciferases, enzymes that catalyze bioluminescence reactions, are used most frequently because their sensitivity and linear response range are superior to those of typical reporters, including β-galactosidase, chloramphenicol acetyltransferase, β-glucuronidase, and green fluorescent protein. Bioluminescence is a simple reaction that is triggered by the addition of luciferin solution and some cofactors, and the equipment for measuring light intensity is simple because it uses only a photomultiplier or a charge-coupled device (CCD) camera; thus, this assay can be applied to high-throughput screening (HTS). Luciferases are the most suitable reporter enzymes for the quantitative measurement of gene expression.
Single Luciferase Reporter Assay
All applications of bioluminescence systems are based on the principle of a chemical reaction; that is, the light intensity as the measurable product depends on the amounts of luciferase, luciferin, and cofactor(s). Using beetle bioluminescence as an example, in the presence of excess luciferin and luciferase, the bioluminescence intensity correlates with the amount of ATP, producing a beetle bioluminescence system that can measure the amount of ATP (Santos, 2003). This system can be applied to detecting bacteria in food, because bacteria contain ATP as an energy source (Venkateswaran et al., 2003). Luciferase is also used as a reporter enzyme to estimate gene expression in prokaryotic or eukaryotic cells, because the amount of luciferase correlates with light intensity in the presence of excess luciferin and ATP. Reporter enzyme assays are used widely in promoter analysis.
Figure 1 demonstrates the simple luciferase reporter assay (Bronstein et al., 1994). In general, the luciferase gene containing the target promoter region of interest in the plasmid is transfected into target cells, and luciferase-expressing cells are lysed for an appropriate period, e.g., 1-2 days. The amount of expressed luciferase protein can be estimated from the light intensity in vitro.
In the transient transfection luciferase assay, the luciferase-expressing cells are first lysed for an appropriate period. Luciferase activity in the cell extracts, measured with a luminometer equipped with a photomultiplier tube, is the most frequently used luciferase assay system because of its high sensitivity and broad linear response (up to 7-8 orders of magnitude) (Roda et al., 2009; Silverman et al., 1998). This system is used widely for basic biological studies, including those of gene expression, post-transcriptional modification, and protein-protein interactions, and for diagnostic and drug discovery applications, because it is suited for HTS. However, we have to normalize the promoter activity using cell number or cellular internal enzyme activity, such as β-galactosidase, β-glucuronidase, chloramphenicol acetyltransferase, thus minimizing inherent experimental variability that can undermine experimental accuracy.
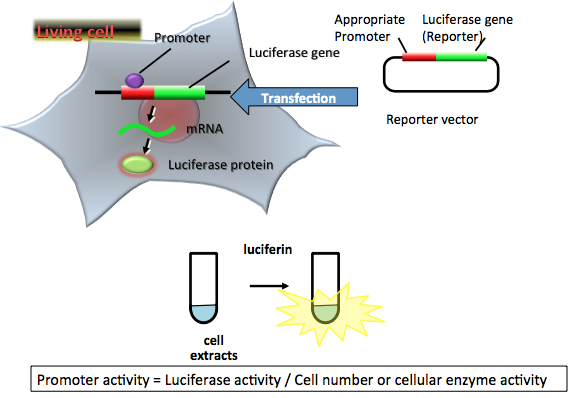
Figure 1. Principle of a simple luciferase reporter assay. The reporter plasmid vector consists of the target promoter sequence and a luciferase gene sequence. After transfection of the plasmid into target cells, the promoter region regulates the expression of luciferase gene in living cells. The expressed luciferase protein catalyzes a reaction with luciferin to produce light. In the transient transfection luciferase assay, luciferase-expressing cells are lysed for an appropriate period. The amount of expressed luciferase protein can be estimated from the light intensity, which indicates the promoter activity in living cells. In this case, the promoter activity is normalized by cell numbers or cellular enzymatic activity. (see: Bronstein et al., 1994)
Dual Non-Secreted Luciferase Reporter Assay
Advances in the transient transfection assay system have added an additional luciferase as an internal control reporter (dual-reporter assay), thereby minimizing inherent experimental variability that can undermine experimental accuracy, such as differences in the number and viability of cells used, the efficiency of cell transfection and lysis, and so on (Grentsmann et al., 1998). In Figure 2, firefly luciferase from Photinus pyralis (FLuc) is used as the experimental reporter, and Renilla luciferase is used as the internal control reporter, which connects to a constitutively expressed promoter, such as the herpes simplex virus thymidine kinase promoter, cytomegalovirus (CMV) immediate-early promoter, or simian virus 40 (SV40) promoter. The general assay system that uses two combinations of reporters is the Dual-Luciferase Reporter Assay System from Promega, in which humanized firefly luciferase and Renilla luciferase are used as the experimental reporter and the internal control reporter, respectively. In this system, both luciferase activities are measured sequentially from single extracts on the basis of their bioluminescent substrate specificity. Firefly luciferase activity is measured first by adding firefly D-luciferin, and then Renilla luciferase activity is measured by adding coelenterazine (another name of Renilla luciferin) with the concomitant quenching of firefly luciferase luminescence. Finally, firefly luciferase activity is normalized by Renilla luciferase activity as a promoter activity.
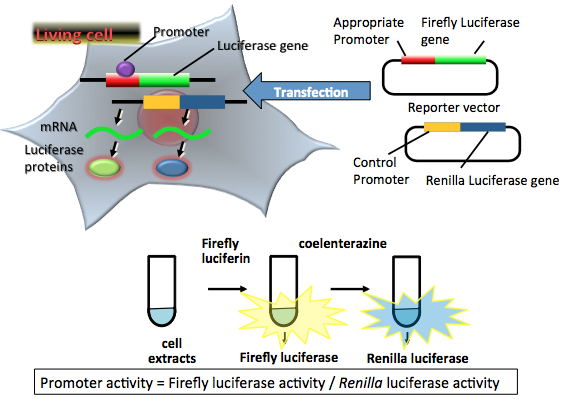
Figure 2. Principle of a dual nonsecreted luciferase reporter assay. Two reporter plasmid vectors consist of the target promoter sequence, the firefly luciferase gene sequence, and the constitutive promoter sequence, and the Renilla luciferase gene sequence as a control. After transfection of the two plasmids into target cells, the promoter region regulates the expression of the luciferase genes in living cells. Firefly luciferase protein catalyzes a reaction with firefly luciferin to produce a yellow-green light. Renilla luciferase protein catalyzes a reaction with coelenterazine (another name of Renilla luciferin) to produce blue light. In the transient transfection dual luciferase assay, luciferase-expressing cells are lysed for an appropriate period. The amounts of expressed luciferase proteins can be estimated from the light intensity. The light intensities indicate the target promoter and control promoter activities in living cells. In this case, the target promoter activity is normalized by the control promoter activity. (see: Grentsmann et al., 1998)
Dual Secreted Luciferase Reporter Assay
Secreted luciferases, CLuc, MetLuc, and GLuc, have been cloned from luminous organisms such as the marine ostracod Cypridina noctiluca, and marine copepods Metridia longa and Gaussia princeps (Nakajima et al., 2004; Verhaegent et al., 2002; Markova et al.; 2004). As a reporter assay, the genes of CLuc, GLuc and MetLuc are used frequently as commercial products (Table 1). When cDNAs for these luciferases are transfected into mammalian cells, the expressed luciferases are secreted into the medium via the endoplasmic reticulum and the Golgi complex. The activities of the secreted luciferases can be quantified easily from the light intensity after the reaction with their substrates: CLuc reacts with Cypridina luciferin and GLuc and MetLuc react with coelenterazine. Of note is that these bioluminescence reactions do not cross-react with each other. The sensitivity and linearity of GLuc and CLuc are of the same level as those of firefly or Renilla luciferase.
Today, there are many examples of the gene expression reporter assays that use a protein or gene of GLuc and CLuc in mammalian cells (Tannous et al., 2005; Nishide et al., 2006; Yamagishi et al., 2006). Figure 3 shows the principle of the dual secreted luciferase reporter assay. In general, for reporter assays, the promoter activities of the target and the control must be determined, because the reproducibility of each assay is the most important consideration. A dual-luciferase reporter assay system using CLuc and GLuc is suitable for the HTS of multiple gene expression, because nonsecreted luciferase reporter assays require sample lysis or special equipment, such as a filtered luminometer (Wu et al., 2007). The activities of the two secreted luciferases can be measured separately and accurately. The dual-reporter assay system using CLuc and GLuc is suitable for the HTS of gene transcription in living cells. However, the dual-reporter assay system can be used only in eukaryotes, because the active form of CLuc is not expressed in Escherichia coli, although GLuc can be expressed as an active form in E. coli.
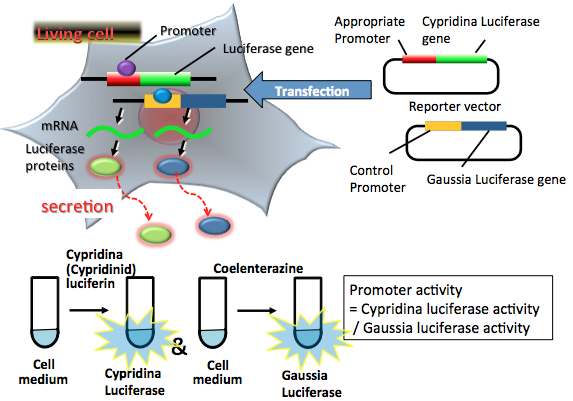
Figure 3. Principle of a dual secreted luciferase reporter assay. The two reporter plasmid vectors consist of the target promoter sequence, the CLuc gene sequence and the constitutive promoter sequence, with the GLuc gene sequence serving as the control. After transfection of the two plasmids into target cells, the promoter region regulates the expression of the luciferase genes in living cells. Both expressed CLuc and GLuc secrete into the medium. CLuc protein catalyzes a reaction with cypridinid luciferin to produce blue light. GLuc protein catalyzes a reaction with coelenterazine to produce blue light. For the two-tube dual secreted luciferase assay, two partial aliquots of luciferases secreted cell medium are collected for an appropriate period. The amounts of expressed luciferase proteins in each tube can be estimated from the light intensity separately. The light intensities indicate the target promoter and control promoter activities in living cells. In this case, the target promoter activity is normalized by control promoter activity. (see: Wu et al., 2007)
Multicolor Luciferase Reporter Assay
The dual luciferase assay system makes it possible to perform simultaneous monitoring of gene expression, intracellular detection of bioactive compounds, and HTS in vitro. However, for diagnostic and drug discovery purposes, both of which require the analysis of a huge number of samples, it is preferable to use an improved assay system whereby gene expression, protein-protein interaction, ligand binding, and post-transcriptional modification can be monitored simultaneously in a one-step reaction in single-cell extracts. This system saves time and money, reduces the amount of sample needed, and facilitates the interpretation of data. Beetle luciferases emit different colors on reacting with firefly D-luciferin, and each emission can be separated by an optical filter. Currently, beetle luciferases (CBGluc, CBRluc, ELuc, SLR, SLG, and SLO) from several species, which display a wide spectral range, are available (Table 1). Figure 4 demonstrates the multicolor luciferase assay (Nakajima, 2005). In this system, the green-emitting luciferase from Rhagophthalmus ohbai (SLG; λmax = 550 nm) (Ohmiya et al., 2000), the orange-emitting luciferase, which is a point mutant of the green-emitting luciferase (SLO; λmax = 580 nm) (Viviani et al., 2001), and the red-emitting luciferase (SLR; λmax = 630 nm) from Phrixothrix hirtus (Viviani et al., 1999) are used as the reporters.
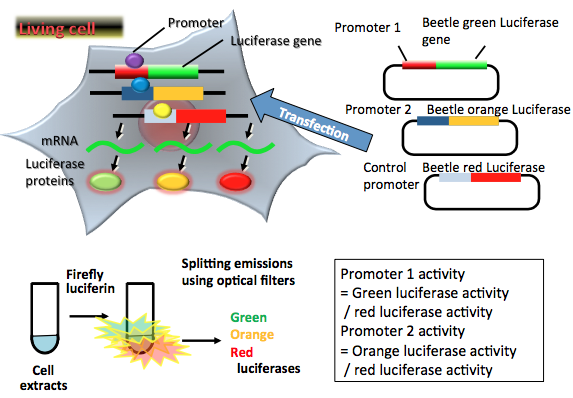
Figure 4. Principle of multicolor luciferase reporter assay. Three reporter plasmid vectors consist of the target promoter sequence (Promoter 1) and the green-emitting beetle luciferase gene sequence, another target promoter sequence (Promoter 2) and the orange-emitting beetle luciferase gene sequence, and the constitutive promoter sequence, and the red-emitting beetle luciferase gene sequence as a control. After transfection of three plasmids into target cells, the promoter regions regulate the expression of luciferase genes in living cells. Green-, orange-, and red-emitting luciferase proteins catalyze a reaction with firefly luciferin to produce green, orange and red light. In the transient transfection multicolor luciferase assay, luciferase-expressing cells are lysed for an appropriate period. The amounts of expressed luciferase proteins can be estimated from the light intensities, the results indicating the amounts of two target promoters and control promoter activities in living cells. In this case, two target promoter activities (green luciferase for Promoter 1 and orange luciferase for Promoter 2) are normalized by the control promoter activity (red luciferase). (see: Nakajima et al., 2005)
Because all of these luciferases emit light with firefly D-luciferin, their individual activities can be detected in a one-step reaction in a single sample. Figure 5A shows a schematic of the measurement of the three luciferase activities in a mixture using >560-nm and >600-nm long-pass filters (O56 and R60) (Nakajima et al., 2005). First, the total relative light units (F0) were measured in the absence of the filters. Then, the F1 value that passed through the O56 filter (striped area) was measured, and finally, the F2 value that passed through the R60 filter (striped area) was measured. Each luciferase activity was calculated using the simultaneous equation (Figure 5B) by substituting F0, F1, and F2 values: where G, O, and R are the activities of the green-, orange-, and red-emitting luciferases, respectively; κGO56, κOO56, and κRO56 are the transmission coefficients of the green-, orange-, and red-emitting luciferases of the O56 filter, respectively; and κGR60, κOR60, and κRR60 are the transmission coefficients of the green-, orange-, and red-emitting luciferases of the R60 filter, respectively. Using this method, we estimated that the linear response range of the system exceeds two orders of magnitude (Figure 5B), although the low-threshold light intensities requires one order of magnitude higher intensity than those estimated in the dual-color luciferase assay system.
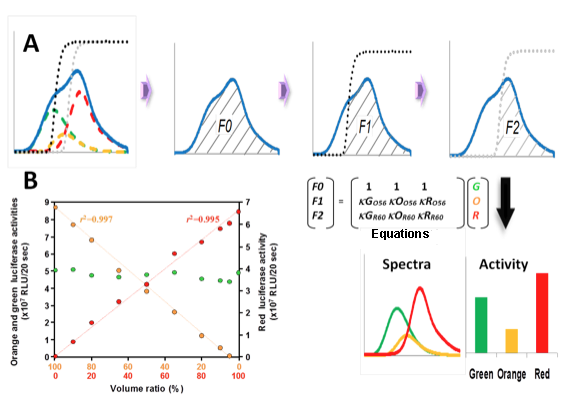
Figure 5. Schematic diagram of the measurement of luciferase activities by splitting emissions using optical filters. (A) Bioluminescence spectra of green-emitting (green dotted line), orange-emitting (orange dotted line) and red-emitting (red dotted line) luciferases, and the transmission spectra of >560 nm (O56, black dotted line) and >600 nm (R60, gray dotted line) long-pass filters. First, the total relative light units (F0) were measured in the absence of the filters. Then, the F1 value that passed through the O56 filter (striped area) was measured, and finally, the F2 value that passed through the R60 filter (striped area) was measured. Each luciferase activity was calculated using the Equations (Figure 5B) by substituting F0, F1 and F2 values. G, O and R are the activities of the green-, orange- and red-emitting luciferases, respectively; kGO56, kOO56 and kRO56 are the transmission coefficients of the green-, orange- and red-emitting luciferases of the O56 filter, respectively; and kGR60, kOR60 and kRR60 are the transmission coefficients of the green-, orange- and red-emitting luciferases of the R60 filter, respectively. (B) Quantitative relationship among green (green circle), orange (orange circles), and red (red circles) luciferase activities in a mixture. (see: Nakajima et al., 2005)
Real Time Luciferase Reporter Assay
One advantage of using a luciferase reporter is that the luminescence can be measured quantitatively and longitudinally with real-time resolution in vitro and in vivo, when a bioluminescent substrate is administered into cells (Gross and Piwnica-Worms, 2005; Welsh and Kay, 2005; Luker and Luker, 2008; Dothager et al., 2009). Among the possible luciferase-luciferin reactions, the firefly luciferase and firefly D-luciferin pair is used most widely, because the luminescence generated by the reaction can be quantified precisely, and has an extremely low background, and because firefly D-luciferin is highly stable and easily permeates cells and tissues. Firefly luciferase and D-luciferin are suitable for use as the reporter and substrate, respectively, for noninvasive measurements.
In Figure 6, after transfection of reporter gene vector, the luciferase-expressing cells in a culture plate is measured with a real time monitoring luminometer equipped with a photomultiplier tube. The noninvasive multicolor luciferase assay was also used in in vitro and in vivo studies of post-translational stabilization, signaling pathways, and protein-protein interactions by using a CCD camera to capture the luciferase emissions (Noguchi, 2008, 2010).
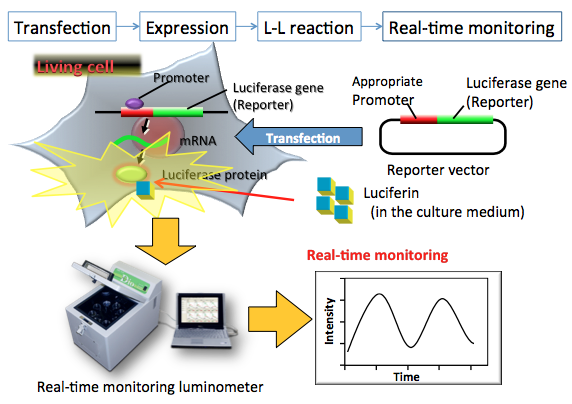
Figure 6. Principle of a real time luciferase reporter assay. The reporter plasmid vector consists of the target promoter sequence and the luciferase gene sequence. After transfection of the plasmid into target cells, the promoter region regulates the expression of the luciferase gene in living cells. For the real time luciferase assay, firefly luciferin in the medium enters into the living luciferase expressed cells, and is oxidized by luciferase immediately, resulting in the production of light. The amount of expressed luciferase protein can be estimated from the light intensity. The light intensity indicates the promoter activity in living cells. In this case, the promoter activity is measured by a real-time monitoring luminometer. (see: Noguchi et al., 2008)
Calcium Ion and ATP Monitoring Using Photoprotein and Beetle Luciferase
A dual-color system for simultaneously monitoring of intracellular Ca2+ and ATP levels through a combination of a Ca2+-sensitive aequorin and ATP-sensitive beetle red luciferase (PxRE) is shown in Figure 7. Aequorin is composed of two distinct units, the apoprotein apoaequorin and the prosthetic group hydroperoxycoelenterazine. When calcium ions bind the calcium binding sites (EF hand motifs), the protein undergoes a conformational change and converts coelenterazine into excited coelenteramide and CO2. As the excited coelenteramide relaxes to the ground state, blue light (λmax = 465 nm) is emitted. PxRe luciferase catalyzes the oxidation of firefly D-luciferin by using ATP in the presence of O2 and Mg2+, and then forms oxyluciferin in an electronically excited state. As the excited oxyluciferin relaxes to the ground state, red light (λmax = 630 nm) is emitted. Using this system, Kwon et al. (2010) detect the dynamic changes simultaneously in both intracellular Ca2+ and ATP levels during chondrogenesis.
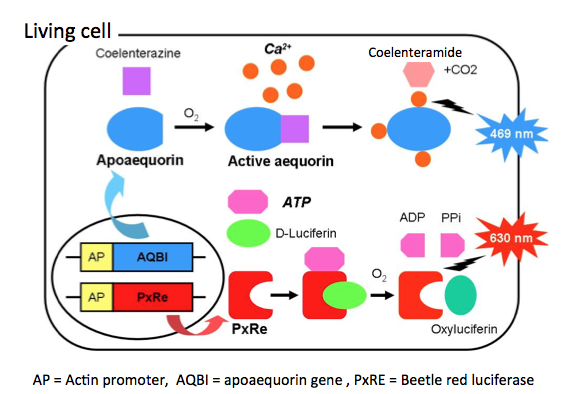
Figure 7. Principle of calcium ion and ATP monitoring using photoprotein and beetle luciferase. This is a dual-color system for simultaneously monitoring the intracellular Ca2+ and ATP levels through a combination of a Ca2+-sensitive aequorin and ATP-sensitive PxRe. Aequorin is composed of two distinct units, the apoprotein apoaequorin and the prosthetic group coelenterazine, a luciferin. When Ca2+ occupies such sites, the protein undergoes a conformational change and converts coelenterazine into excited coelenteramide and CO2. As the excited coelenteramide relaxes to the ground state, blue light (λmax = 465 nm) is emitted. PxRe luciferase catalyzes the oxidation of D-luciferin by using ATP in the presence of O2 and Mg2+, and then forms oxyluciferin in an electronically excited state. As the excited oxyluciferin relaxes to the ground state, red light (λmax = 630 nm) is emitted. (see: Kwon et al., 2010)
Bioluminescence Imaging
Among known optical imaging techniques, molecular imaging using either fluorescent or bioluminescent reporters is one of the most sensitive methods, and uses the most cost-effective and simplest procedure. Fluorescence imaging using a fluorescent dye molecule or a genetically encoded fluorescent protein and its derivatives has contributed immensely to the advancement of cell biology, and provides a powerful tool to image an extensive array of samples, ranging from single molecules to whole organisms (Giepmans et al., 2006; Ghasemi et al., 2009; Day and Davidson, 2009; DiPilato and Zhang, 2010). However, because fluorescent reporters require exogenous illumination to emit light, this technique is not appropriate for long-term and quantitative imaging for the following reasons: (1) the fluorescent reporter is bleached by repetitive illumination; (2) repetitive exogenous light illumination causes phototoxic damage to cells; and (3) exogenous illumination perturbs the physiology in light-sensitive tissue such as the retina. In contrast, bioluminescence imaging using luciferase reporters does not need exogenous light illumination, and the luminescence reaction is quantitative, and has an extremely low background. This imaging method is particularly useful for longitudinal and quantitative imaging.
In vitro Bioluminescence Imaging
The spatiotemporal resolution of bioluminescence imaging was improved by the development of the enhanced green-emitting beetle luciferase from Pyrearinus termitilluminans (ELuc) (Nakajima et al., 2010), whose light signal in mammalian cells is more than 10-fold greater than that of firefly luciferase. Although a luciferase reporter is currently used for bioluminescence imaging, including at the single-cell level, it can be difficult to perform subcellular or organelle imaging because of inadequate signal intensity in viable cells, and because a greater luminescence intensity is required for subcellular imaging with a higher-magnification lens. Figure 8 shows the subcellular localization of ELuc with high resolution in mammalian cells in cytosol, peroxisome, and nucleus (Nakajima et al., 2010).
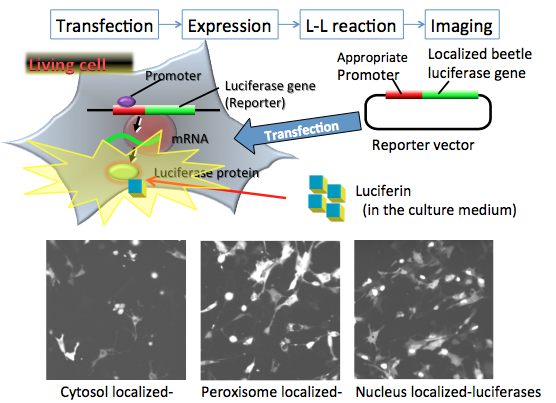
Figure 8. In vitro bioluminescence imaging for organelles in living cells. The reporter plasmid vectors consist of the constitutive promoter sequence and the organelle targeting luciferase gene sequence for cytosol, peroxisome and nucleus in mammalian cells. After transfection of the plasmid into target cells, the promoter region regulates the expression of luciferase genes in living cells. For the imaging experiment, firefly luciferin added to the medium enters into the organelle, where it is catalyzed by the expressed firefly luciferase to generate light. The localization of expressed luciferase protein can be visualized by the light signal, which indicates the locality or mobility of organelles in living cells. In this case, the bioluminescence imaging is measured by special equipment using a CCD photon imaging system. (see: Nakajima et al., 2010)
Figure 9 shows the time-lapse imaging of the nucleocytoplasmic shuttling of ELuc-fused importin-α (mRch1) (Imamoto et al., 1996; Goldfarbet al., 2004), a shuttling nuclear import receptor for nuclear localization signal-containing protein. The luminescence signal was detected initially in the cytosol; after 24 min, the signal increased gradually in the nucleus, and this was accompanied by a decrease of the signal in the cytosol. Conversely, the signal in the nucleus decreased gradually after 52 min of measurement with a concomitant increase in cytosolic signal for up to 80 min of measurement. An accumulation of the signal in the nucleus was observed again from 84 to 128 min of measurement (Nakajima et al., 2010).
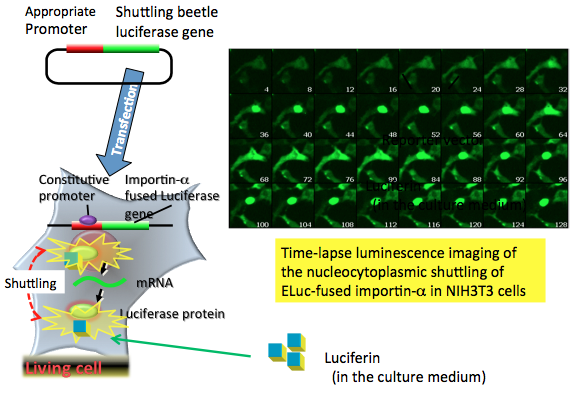
Figure 9. Time-lapse bioluminescence imaging of the nucleocytoplasmic shuttling. The reporter plasmid vector consists of the constitutive promoter sequence and an importin-α fused luciferase gene sequence. After transfection of the plasmid into target cells, the promoter region regulates the expression of luciferase genes in living cells. For the time-lapse bioluminescence imaging experiment, firefly luciferin that is added to the medium enters the importin-α luciferase expressed cells, where it is catalyzed by the expressed firefly luciferase to generate light. The light signal indicates the nucleocytoplasmic shuttling of importin-α in living cells. In this case, the bioluminescence imaging is measured by special equipment using a CCD photon imaging system. (see: Nakajima et al., 2010)
In vivo Bioluminescence Imaging
In in vivo bioluminescence imaging, one of the most frequently used applications is cell tracking (Rehmtulla et al., 2000). In this application, luciferase-expressing cancer cells, immune cells, stem cells, or other types of cells can be imaged repeatedly in small animals. In this method, luciferase gene transfects to a suitable cell line, and establishes the luciferase expressed stable cell line. The luciferase-expressed cells are injected into an animal and imaged at appropriate times (Figure 10). This method provides information about the number and spatial distribution of the cells in the animal.
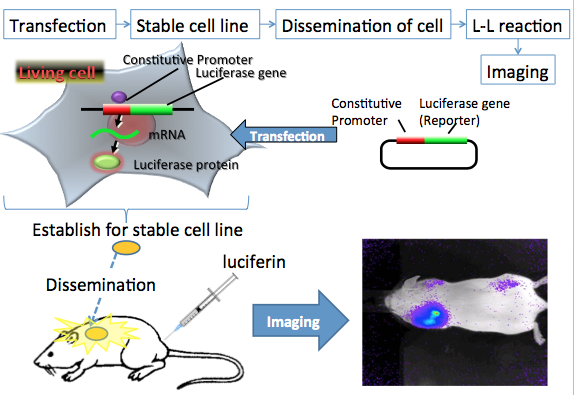
Figure 10. In vivo bioluminescence imaging using luminescent living cells. The reporter plasmid vector consists of the constitutive promoter sequence and a luciferase gene sequence. The reporter plasmid vector also consists of the antibiotic resistance sequence. After transfection of the plasmid into target cancer cells, the promoter region regulates the expression of the luciferase gene in living cells. The luciferase expressed stable cells are transplanted into the mouse. After an appropriate period for cancer cell growth, luciferin is injected into the body. For the in vivo imaging experiments, firefly luciferin enters into the cells from the blood, where it is catalyzed by the expressed firefly luciferase to generate light. The light signals indicate the location and size of cancer cells in the body. In this case, the bioluminescence imaging is measured by special equipment using a CCD photon imaging system. (see: Rehmtulla et al., 2000)
Another approach for in vivo bioluminescence imaging is based on a luciferase protein probe. The antibody-fused luciferase visualizes disease-specific antigens on cell surfaces in a living body after the conjugation of luciferase and antibody. The purified probe is injected into mice. Twenty-four hours after the administration of the antibody fused luciferase probe, luciferin was injected, and the bioluminescence images were obtained using a CCD photon imaging system (Figure 11).
For this technique, Wu et al. (2009) developed a far-red luminescence imaging technology for the visualization of disease specific antigens on cell surfaces in a living body. First, they conjugated a far-red fluorescent indocyanine derivative to biotinylated Cypridina luciferase (CLuc). This conjugate produced a bimodal spectrum that has long-wavelength bioluminescence emission in the far-red region, as a result of bioluminescence resonance energy transfer. To generate a far-red luminescent probe with targeting and imaging capabilities for tumors, they then linked this conjugate to an anti-human Dlk-1 monoclonal antibody via the biotin-avidin interaction. This far-red luminescent probe is a convenient analytical tool for the evaluation of monoclonal antibody localization in a living body.
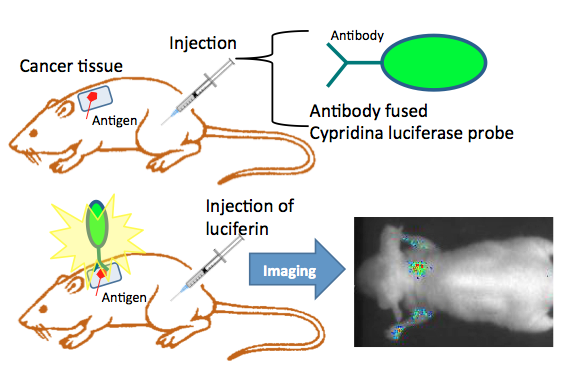
Figure 11. In vivo bioluminescence imaging using an antibody-fused luciferase probe. Cypridina luciferase is expressed in a suitable expression system, and is purified by chromatography. An antibody fused Cypridina luciferase consists of Cypridina luciferase and antibody protein for an antigen on the cell membrane via, e.g., biotin-avidin conjugation. The targeted antigen expressed cell line was implanted into the back of mice. Tumor growth was monitored until it reached an acceptable size. For in vivo imaging, the antibody fused Cypridina luciferase was injected into mice intravenously. To obtain a bioluminescence image, the mice were given injections of Cypridina luciferin at appropriate times. Bioluminescence imaging was performed by special equipment using an intensified CCD camera. (see: Wu et al., 2009)
Ex vivo Bioluminescence Imaging
On microscopic examination, the tumor tissue included moderately differentiated tubular glands and fibrous stroma. Immunohistochemical staining showed that the tumor cells were strongly immunoreactive toward antigen. Figure 12 shows the procedure of immunohistochemical visualization using an indirect peroxidase labeling and a direct luciferase labeling (Wu et al., 2013). At first, three sections among the serial paraffin sections were pretreated by heating them in a microwave oven. In the immunohistochemical detection, after the incubation of the first antibody, the section is twice washed with PBS buffer, and incubated with the second antibody-conjugated peroxidase. After washing twice with buffer, the section for cancer was prepared for immunohistochemical staining by suitable methods.
After incubating the sample for 30-60 min with the anti-cancer antibody-luciferase conjugate, the sample is directly visualized by the luciferin-luciferase reaction. After incubation and washing, a cypridinid luciferin solution is added to the section under darkened conditions; images of the bioluminescence from the tumor cells are quickly acquired using a cooled CCD camera system operated at a high sensitivity range. The bioluminescence images were strong, and corresponded to those obtained by immunohistochemical staining.
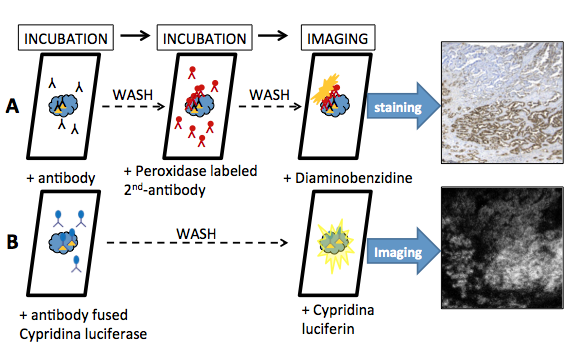
Figure 12. Ex vivo bioluminescence imaging using an antibody-fused luciferase probe. (A) Procedure of immunohistochemical visualization for serial paraffin sections using an indirect peroxidase labeling is as follows. The immunohistochemical staining was carried out using a monoclonal antibody. After washing with PBS, the section was incubated with the secondary peroxidase labeled antibody. Finally, the immunohistochemical staining used diaminobenzidine. (B) Cypridina luciferase is expressed in a suitable expression system, and is purified by chromatography. An antibody fused Cypridina luciferase consists of antibody protein for antigen and Cypridina luciferase via, e.g., biotin-avidin conjugation. The procedure for immunohistochemical visualization for serial paraffin sections using a direct luciferase labeling is as follows; the immunohistochemical staining was carried out using the antibody fused Cypridina luciferase. After washing with PBS, the section is imaged using the Cypridina luciferin-luciferase reaction. Bioluminescence imaging was performed with special equipment using an intensified CCD camera. (see: Wu et al., 2013)
Conclusion
In the post genome era, we must clarify quantitatively and spatially the complex phenomena of biological systems in real time. Bioluminescence based on the diversity of luminescent molecules has great potential as an assay tool, because the light is produced by enzyme reactions inherent within the physiological systems of living organisms. Such assays can be used to analyze the complex phenomena in biological systems, which can be detected as light signal outputs that correspond to specific biological events. As described in this review, bioluminescence has many applications and bioluminescence assays are expected to become essential research tools. Finally, it is essential to consider the underlying principle and the characteristics of bioluminescent reactions, and to select a suitable bioluminescence system depending on the assay purpose.
References
Bronstein I., Fortin J., Stanley P. E., Stewart G.S., and Kricka J. J. (1994) Chemiluminescent and bioluminescent reporter gene assays. Anal Biochem 219: 169-181.
Day R. N. and Davidson M. W. (2009) The fluorescent protein palette: tools for cellular imaging. Chem. Soc. Rev. 38: 2887–2921.
DiPilato L. M. and Zhang J. (2010) Fluorescent protein-based biosensors: resolving spatiotemporal dynamics of signaling. Curr. Opin. Chem. Biol. 4: 37–42.
Dothager R. S., Flentie K., Moss B., Pan M. H., Kesarwala A., and Piwnica-Worms D. (2009) Advances in bioluminescence imaging of live animal models. Curr. Opin. Biotech. 20:45–53.
Ghasemi Y., Peymani P., and Afifi S. (2009) Quantum dot: magic nanoparticle for imaging, detection and targeting. Acta Biomed. 80: 156–165
Giepmans B., Adams S., Ellisman M., and Tsien R. (2006) The fluorescent toolbox for assessing protein location and function. Science 312:217–224.
Goldfarb D. S., Corbett A. H., Mason D. A., Harreman M. T., and Adam S. A. (2004) Importin alpha: a multipurpose nuclear-transport receptor. Trends Cell Biol. 14: 505–514.
Greer L. F. and Szalay A. A. (2002) Imaging of light emission from the expression of luciferases in living cells and organisms: a review. Luminescence 17: 43–74.
Grentsmann G., Ingram J. A., Kelly P. J., Gesteland R. F., and Atkins J. F. (1998) A dual-luciferase reporter system for studying recoding signals. RNA. 4: 479–486.
Gross S., and Piwnica-Worms D. (2005) Spying on cancer: molecular imaging in vivo with genetically encoded reporters. Cancer Cell 7: 5–15.
Imamoto N., Shimamoto T., Takao T., Tachibana T., Kose S., Matsubae M., Sekimoto T., Shimonishi Y., and Yoneda Y. (1996) In vivo evidence for involvement of a 58 kDa component of nuclear pore-targeting complex in nuclear protein import. EMBO J. 14: 3617–3626.
Kwon H. J., Ohmiya Y., and Yasuda K. (2010) Dual-color system for simultaneously monitoring intracellular Ca2+ and ATP dynamics. Anal Biochem. 430:45-47.
Luker K. E. and Luker G. D. (2008) Applications of bioluminescence imaging to antiviral research and therapy: multiple luciferase enzymes and quantitation. Antiviral Res. 78: 179–187.
Markova S. V., Golz S., Frank L. A., Kalthof B., and Vysotski E. S. (2004) Cloning and expression of cDNA for a luciferase from the marine copepod Metridia longa: a novel secreted bioluminescent reporter enzyme. J. Biol. Chem. 279: 3212–3217.
Nakajima Y., Kobayashi K., Yamagishi K., Enomoto T., and Ohmiya Y. (2004) cDNA cloning and characterization of a secreted luciferase from the luminous Japanese ostracod, Cypridina noctiluca. Biosci. Biotechnol. Biochem. 68: 565–570.
Nakajima Y., Kimura T., Sugata K., Enomoto T., Asakawa T., Kubota H., Ikeda M., and Ohmiya Y. (2005) A multicolor luciferase assay system, one-step monitoring of multiple gene expressions with a single substrate. Biotechniques 38:891–894.
Nakajima Y. and Ohmiya Y. (2010) Bioluminescence assays: multicolor luciferase assay, secreted luciferase assay and imaging luciferase assay. Expert Opinion Drag Discovery 5: 835-849.
Nakajima Y. Yamazaki T., Nishii S., Noguchi T., Hoshino H., Niwa K., Viviani V. R., and Ohmiya Y. (2010) Enhanced beetle luciferase for high-resolution bioluminescence imaging. PLoS ONE 5:e10011.
Noguchi T., Ikeda M., Ohmiya Y., and Nakajima Y. (2008): Simultaneous monitoring of independent gene expression patterns in two types of cocultured fibroblasts with different color-emitting luciferases. BMC Biotechnol. 8: 40.
Noguchi T., Michihata T., Nakamura W., Takumi T., Shimizu R., Yamamoto M., Ikeda M., Ohmiya Y., and Nakajima Y. (2010) Dual-Color luciferase mouse directly demonstrates coupled expression of two clock genes. Biochemistry 49: 8053–8061.
Nishide S., Honma S., Nakajima Y., Ikeda M., Baba K., Ohmiya Y., and Honma K. (2006) New reporter system for Per1 and Bmal1 expressions revealed self-sustained circadian rhythms in peripheral tissues. Genes Cells 11:1173–1182.
Ohmiya Y., Sumiya M., Viviani V. R., Ohba N. (2000) Comparative aspects of a luciferase molecule from Japanese luminous beetle, Rhagophthalmus ohbai. Sci Rept Yokosuka City Mus. 7: 31–38.
Rehmtulla A,, Stegman L. D., Cardozo S. J., Gupta S, Hall D. E., Contag C. H., and Ross B. D. (2000) Rapid and quantitative assessment of cancer treatment response using in vivo bioluminescence imaging. Neoplasia 2: 491–495.
Roda A., Guardigli M., Michelini E. and Mirasoli M. (2009) Bioluminescence in analytical chemistry and in vivo imaging. Trends Anal. Chem. 28: 307–322.
Santos D. A., Salgado A. I., and Cunha R. A. (2003) ATP is released from nerve terminals and from activated muscle fibers on stimulation of the rat phrenic nerve. Neurosci. Lett. 338: 225–228.
Silverman L., Campbell R., and Broach J. R. (1998) New assay technology for high-throughput screening. Curr. Opin. Chem. Biol. 2: 397–403.
Tannous B. A. , Kim D. E., Fernandez J. F., Weissleder R., and Breakefield X. O. (2005) Codon-optimized Gaussia luciferase cDNA for mammalian gene expression in culture and in vivo. Mol. Ther. 11: 435–443.
Venkateswaran K., Hattori N., La Duc M. T., and Kern R. (2003) ATP as a biomarker of viable microorganisms in clean-room facilities. J. Microbiol. Methods 52: 367–77.
Verhaegent M. and Christopoulos T. K. (2002) Recombinant Gaussia luciferase overexpression, purification, and analytical application of a bioluminescent reporter for DNA hybridization. Anal. Chem. 74: 4378-4385.
Viviani V. R., Bechara E. J. , and Ohmiya Y. (1999) Cloning, sequence analysis, and expression of active Phrixothrix railroad-worms luciferases: relationship between bioluminescence spectra and primary structures. Biochemistry 38: 8271–8279.
Viviani V. R., Uchida A., Suenaga N., Ryufuku M., and Ohmiya Y. (2001) Thr226 is a key residue for bioluminescence spectra determination in beetle luciferases. Biochem. Biophys. Res. Commun. 280: 1286–1291.
Welsh D. K. and Kay S. A. (2005) Bioluminescence imaging in living organisms. Curr. Opin. Biotechnol. 16: 73–78.
Wilson T. and Hastings J. W. (1998) Bioluminescence. Annu Rev Cell Dev Biol 14: 197–230.
Wu C,. Suzuki-Ogoh C., and Ohmiya Y. (2007) Dual-reporter assay using two secreted luciferase genes. Biotechniques 42: 290–292.
Wu C., Mino K., Akimoto H., Kawabata M., Nakamura K., Ozaki M., and Ohmiya Y. (2009) In vivo far-red luminescence imaging of a biomarker based on BRET from Cypridina bioluminescence to an organic dye. Proc. Natl. Acad. Sci. USA. 106:15599-15603.
Wu C., Wang K. Y., Guo X., Sato M., Ozaki M., Shimajiri S., Ohmiya Y., and Sasaguri Y. (2013) Rapid methods of detecting the target molecule in immunohistology using a bioluminescence probe. Luminescence 28: 38-43.
Yamagishi K,. Enomoto T., and Ohmiya Y. (2006) Perfusion-culture-based secreted bioluminescence reporter assay in living cells. Anal. Biochem. 354: 15–21.
01/29/14